Venn diagram
From Wikipedia, the free encyclopedia

Venn diagrams or set diagrams are diagrams that show all hypothetically possible logical relations between a finite collection of sets (groups of things). Venn diagrams were conceived around 1880 by John Venn. They are used in many fields, including set theory, probability, logic, statistics, and computer science.
Contents |
[edit] Overview

A Venn diagram is constructed with a collection of simple closed curves drawn in the plane. The principle of these diagrams is that classes or sets be represented by regions in such relation to one another that all the possible logical relations of these classes can be indicated in the same diagram. That is, the diagram initially leaves room for any possible relation of the classes, and the actual or given relation, can then be specified by indicating that some particular region is null or is notnull.[1]
Venn diagrams normally consist of overlapping circles. For instance, in a two-set Venn diagram, one circle may represent the group of all wooden objects, while another circle may represent the set of all tables. The overlapping area (intersection) would then represent the set of all wooden tables. Shapes other than circles can be employed (see below), and this is necessary for more than three sets.
Venn diagrams are very similar to Euler diagrams, but whereas a Venn diagram for n component sets must contain all 2n hypothetically possible zones corresponding to some combination of being included or excluded in each of the component sets, Euler diagrams contain only the actually possible zones in a given context. In Venn diagrams, a shaded zone may be to represent an empty zone, whereas in an Euler diagram the corresponding zone is missing from the diagram. For example, if one set represents "dairy products" and another "cheeses", then the Venn diagram contains a zone for cheeses that are not dairy products. Assuming that in the context "cheese" means some type of dairy product, the Euler diagram will have the cheese zone entirely contained within the dairy-product zone; there is no zone for (non-existent) non-dairy cheese. This means that as the number of contours increase, Euler diagrams are typically less visually complex than the equivalent Venn diagram, particularly if the number of non-empty intersections is small.[2]
[edit] History
Venn diagrams were introduced[3] in 1880 by John Venn (1834-1923) in a paper entitled "On the Diagrammatic and Mechanical Representation of Propositions and Reasonings" which appeared in the "Philosophical Magazine and Journal of Science" in July 1880.[4] The use of diagrams in formal logic is not an easy history to trace, but it is certain that the diagrams that are popularly associated with Venn, in fact, originated much earlier. They are rightly associated with Venn, however, because he comprehensively surveyed and formalized their usage, and was the first to generalize them. The term "Venn diagram" itself was first used by Clarence Irving Lewis in 1918, in his book "A Survey of Symbolic Logic".[4]
Venn diagrams are very similar to Euler diagrams, which were invented by Leonhard Euler (1708-1783) in the 18th century.[5] M. E. Baron has noted that Leibniz (1646-1716) in the 17th century produced similar diagrams before Euler, however, much of it was unpublished. She also observes even earlier Euler-like diagrams by Ramon Lull in the 13th Century.[6]
In the 20th century Venn diagrams were further developed. D.W. Henderson showed in 1963 that the existence of an n-Venn diagram with n-fold rotational symmetry implied that n was prime.[7] He also showed that such symmetric Venn diagrams exist when n is 5 or 7. In 2002 Peter Hamburger found symmetric Venn diagrams for n = 11 and in 2003, Griggs, Killian, and Savage showed that symmetric Venn diagrams exist for all other primes. Thus symmetric Venn diagrams exist if and only if n is a prime number.[8]
Venn diagrams were incorporated as part of instruction in set theory as part of the new math movement in the 1960s. Since then, they have also been adopted by other curriculum fields such as reading [9]
[edit] Example

The following example involves two sets, A and B, represented here as coloured circles. The orange circle, set A, represents all living creatures that are two-legged. The blue circle, set B, represents the living creatures that can fly. Each separate type of creature can be imagined as a point somewhere in the diagram. Living creatures that both can fly and have two legs — for example, parrots — are then in both sets, so they correspond to points in the area where the blue and orange circles overlap. That area contains all such and only such living creatures.
Humans and penguins are bipedal, and so are then in the orange circle, but since they cannot fly they appear in the left part of the orange circle, where it does not overlap with the blue circle. Mosquitoes have six legs, and fly, so the point for mosquitoes is in the part of the blue circle that does not overlap with the orange one. Creatures that are not two-legged and cannot fly (for example, whales and spiders) would all be represented by points outside both circles.
The combined area of sets A and B is called the union of A and B, denoted by A ∪ B. The union in this case contains all things that either have two legs, or that fly, or both.
The area in both A and B, where the two sets overlap, is called the intersection of A and B, denoted by A ∩ B. For the example, the intersection of the two sets is not empty, because there are points representing creatures that are in both the orange and blue circles.
Sometimes a rectangle called the "Universal set" is drawn around the Venn diagram to show the space of all possible things. As mentioned above, a whale would be represented by a point that is not in the union, but is in the Universe (of living creatures, or of all things, depending on how one chose to define the Universe for a particular diagram).
[edit] Extensions to higher numbers of sets

|

|

|

|
While Venn diagrams typically support three sets, there are forms that allow for higher numbers. Venn was keen to find symmetrical figures…elegant in themselves representing higher numbers of sets and he devised a four-set diagram using ellipses.(See above) He also gave a construction for Venn diagrams for any number of sets, where each successive curve delimiting a set is interleaved with previous curves, starting with the 3-circle diagram.
[edit] Edwards' Venn diagrams

|

|
|

|
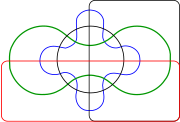
A. W. F. Edwards gave a construction to higher numbers of sets that features some symmetries. His construction is achieved by projecting the Venn diagram onto a sphere. Three sets can be easily represented by taking three hemispheres at right angles (x=0, y=0 and z=0). A fourth set can be represented by taking a curve similar to the seam on a tennis ball which winds up and down around the equator. The resulting sets can then be projected back to the plane to give cogwheel diagrams with increasing numbers of teeth. These diagrams were devised while designing a stained-glass window in memoriam to Venn.
[edit] Other diagrams
Edwards' Venn diagrams are topologically equivalent to diagrams devised by Branko Grünbaum which were based around intersecting polygons with increasing numbers of sides. They are also 2-dimensional representations of hypercubes.
Smith devised similar n-set diagrams using sine curves with equations y=sin(2ix)/2i, 0=i=n-2.
Charles Lutwidge Dodgson (a.k.a. Lewis Carroll) devised a five set diagram.
[edit] Tools for making Venn Diagrams
[edit] See also
- Boolean algebra (logic)
- Bubble chart
- Carroll diagram
- Euler diagram
- Graphic organizers
- Karnaugh map
- Mrs. Miniver's problem
- Spider diagram
- Mathematical diagram
- Vesica piscis
[edit] References
- ^ Clarence Irving Lewis (1918). A Survey of Symbolic Logic. Republished in part by Dover in 1960. p.157.
- ^ Euler Diagrams, Brighton, UK September 22-23 2004. Retrieved 13 August 2008.
- ^ J. Venn, On the Diagrammatic and Mechanical Representation of Propositions and Reasonings, Philosophical Magazine and Journal of Science, Series 5, vol. 9, No. 50, July 1880.
- ^ a b F. Ruskey and M. Weston (2005). "Venn Diagram Survey". In: The electronic journal of combinatorics (ed. June 2005)
- ^ In Euler's Letters to a German Princess. In Venn's article, however, he suggests that the diagrammatic idea predates Euler, and is attributable to C. Weise or J. C. Lange.
- ^ M. E. Baron. "A Note on The Historical Development of Logic Diagrams". In: The Mathematical Gazette: The Journal of the Mathematical Association. Vol LIII, no. 383 May 1969
- ^ D. W. Henderson, "Venn diagrams for more than four classes". American Mathematical Monthly, 70 (1963) 424–426.
- ^ Ruskey, Frank; Carla D. Savage, and Stan Wagon (December 2006). "The Search for Simple Symmetric Venn Diagrams" (PDF). Notices of the AMS 53 (11): 1304–1311. http://www.ams.org/notices/200611/fea-wagon.pdf. Retrieved on 2007-04-27.
- ^ Strategies for Reading Comprehension Venn Diagrams
[edit] Further reading
- A Survey of Venn Diagrams by F. Ruskey and M. Weston, is an extensive site with much recent research and many beautiful figures.
- I. Stewart (2004) Another Fine Math You've Got Me Into, Dover Publications Inc. ISBN 0486431819 ch4
- A.W.F. Edwards (2004) Cogwheels of the Mind: the story of Venn diagrams, Johns Hopkins University Press, Baltimore and London. ISBN 0801874343
- John Venn (1880). "On the Diagrammatic and Mechanical Representation of Propositions and Reasonings". Dublin Philosophical Magazine and Journal of Science 9 (59): 1--18.
[edit] External links
| Wikimedia Commons has media related to: Venn diagrams |
- Create and View Venn Diagrams - interactive Venn diagram
- LogicTutorial.com - interactive Johnston diagram
- Lewis Carroll's Logic Game — Venn vs. Euler at cut-the-knot
- A Survey of Venn Diagrams

