State diagram
From Wikipedia, the free encyclopedia
A state diagram is a type of diagram used in computer science and related fields to describe the behavior of systems. State diagrams require that the system described is composed of a finite number of states; sometimes, this is indeed the case, while at other times this is a reasonable abstraction. There are many forms of state diagrams, which differ slightly and have different semantics.
Contents |
[edit] Overview
State diagrams are used to describe the behavior of a system. State diagrams can describe the possible states of an object as events occur. Each diagram usually represents objects of a single class and track the different states of its objects through the system.[1]
State diagram can be used to graphically represent finite state machines. This was introduced by Taylor Booth in his 1967 book "Sequential Machines and Automata Theory". Another possible representation is the State transition table.
[edit] Directed graph
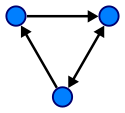
A classic form of a state diagram for a finite state machine is a directed graph with the following elements:[2][3]
- States Q: a finite set of vertices normally represented by circles and labelled with unique designator symbols or words written inside them;
- Input symbols Σ: a finite collection of input symbols or designators;
- Output symbols Z: a finite collection of output symbols or designators;
The output function ω represents the mapping of input symbols into output symbols, denoted mathematically as ω : Σ × Q→ Z.
- Edges δ: represent the "transitions" between two states as caused by the input (identified by their symbols drawn on the "edges"). An 'edge' is usually drawn as an arrow directed from the present-state toward the next-state. This mapping describes the state transitions that is to occur on input of a particular symbol. This is written mathematically as δ : Σ × Q → Z
- Start state q0: (not shown in the examples below). The start state q0 ∈ Q is usually represented by an arrow with no origin pointing to the state. In older texts[2][4], the start state is not shown and must be inferred from the text.
- Accepting state(s) F: If used, for example for accepting automata, F ∈ Q is the accepting state. It is usually drawn as a double circle. Sometimes the accept state(s) function as "Final" (halt, trapped) states[3].
For a deterministic finite state machine (DFA), nondeterministic finite state machine (NFA), generalized nondeterministic finite state machine (GNFA), or Moore machine, the input is denoted on each edge. For a Mealy machine, input and output are signified on each edge, separated with a slash "/": "1/0" denotes the state change upon encountering the symbol "1" causing the symbol "0" to be output. For a Moore machine the state's output is usually written inside the state's circle, also separated from the state's designator with a slash "/". There are also variants that combine these two notations.
For example, if a state has a number of outputs (e.g. "a= motor counter-clockwise=1, b= caution light inactive=0") the diagram should reflect this : e.g. "q5/1,0" designates state q5 with outputs a=1, b=0. This designator will be written inside the state's circle.
[edit] Example: DFA, NFA, GNFA, or Moore machine
S1 and S2 are states and S1 is an accepting state. Each edge is labeled with the input. This example shows an acceptor for strings over {0,1} that contain an even number of zeros.

[edit] Example: Mealy machine
S0, S1, and S2 are states. Each edge is labeled with "j / k" where j is the input and k is the output.

[edit] Harel statechart
Harel statecharts[5] are gaining widespread usage since a variant has become part of the Unified Modeling Language. The diagram type allows the modeling of superstates, concurrent states, and activities as part of a state.
Classic state diagrams require the creation of distinct nodes for every valid combination of parameters that define the state. This can lead to a very large number of nodes and transitions between nodes for all but the simplest of systems. This complexity reduces the readability of the state diagram. With Harel statecharts it is possible to model multiple cross-functional state diagrams within the statechart. Each of these cross-functional state machines can transition internally without affecting the other state machines in the statechart. The current state of each cross-functional state machine in the statechart defines the state of the system. The Harel statechart equivalent to a state diagram but it improves the readability of the resulting diagram.
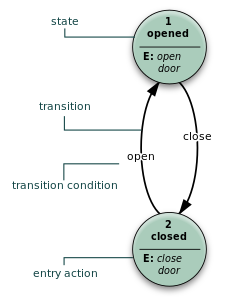
[edit] UML state diagram
The Unified Modeling Language (UML) state diagram is essentially a Harel statechart with standardized notation[6], which can describe many systems, from computer programs to business processes. The following are the basic notational elements that can be used to make up a diagram:
- Filled circle, pointing to the initial state
- Hollow circle containing a smaller filled circle, indicating the final state (if any)
- Rounded rectangle, denoting a state. Top of the rectangle contains a name of the state. Can contain a horizontal line in the middle, below which the activities that are done in that state are indicated
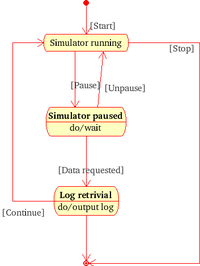
- Arrow, denoting transition. The name of the event (if any) causing this transition labels the arrow body. A guard (computing) expression may be added before a "/" and enclosed in square-brackets ( eventName[guardExpression] ), denoting that this expression must be true for the transition to take place. If an action is performed during this transition, it is added to the label following a "/" ( eventName[guardExpression]/action ).
- Thick horizontal line with either x>1 lines entering and 1 line leaving or 1 line entering and x>1 lines leaving. These denote join/fork, respectively.
According to Pilone[7], the only predefined guard condition is ELSE. No other examples are provided within that publication.
[edit] Other extensions
An interesting extension is to allow arcs to flow from any number of states to any number of states. This only makes sense if the system is allowed to be in multiple states at once, which implies that an individual state only describes a condition or other partial aspect of the overall, global state. The resulting formalism is known as a Petri net.
Another extension allows the integration of flowcharts within Harel statecharts. This extension supports the development of software that is both event driven and workflow driven.
[edit] See also
- SCXML an XML language that provides a generic state-machine based execution environment based on Harel statecharts.
- David Harel
[edit] References
- ^ State Diagrams. Retrieved 11 August 2008.
- ^ a b Taylor Booth (1967) Sequential Machines and Automata Theory, John Wiley and Sons, New York.
- ^ a b John Hopcroft and Jeffrey Ullman (1979) Introduction to Automata Theory, Languages, and Computation, Addison-Wesley Publishing Company, Reading Mass, ISBN 0-201-02988-X
- ^ Edward J. McClusky, Introduction to the Theory of Switching Circuits, McGraw-Hill, 1965
- ^ David Harel, Statecharts: A visual formalism for complex systems. Science of Computer Programming, 8(3):231–274, June 1987.
- ^ D. Drusinsky, Modelling and verification using UML statecharts, Elsevier, 2006
- ^ Dan Pilone, UML 2.0 Pocket Reference, O'Reilly, 2006
[edit] External links
| Wikimedia Commons has media related to: State diagrams |
- Introduction to UML 2 State Machine Diagrams by Scott W. Ambler
- UML 2 State Machine Diagram Guidelines by Scott W. Ambler
- Advanced State Management - video introduction to state charts and thinking in hierarchical states.
- Intelliwizard - UML StateWizard - A ClassWizard-like round-trip UML dynamic modeling/development framework and tool running in popular IDEs under open-source license.
|
||||||||||||||||||||

