PSTricks
From Wikipedia, the free encyclopedia
PSTricks is a set of macros that allow the inclusion of PostScript drawings directly inside TeX or LaTeX code. It is originally the work of Professor Timothy Van Zandt and in recent years it has been maintained by Denis Girou, Sebastian Rahtz and Herbert Voss.
Contents |
[edit] Basic usage

There is a wide list of commands available for making graphics. Coordinates in PSTricks are always represented in round parenthesis as the following example (scaled) illustrates.
\begin{pspicture}(6,6)
  %% Triangle in red:
  \psline[linecolor=red](1,1)(5,1)(1,4)(1,1)
  %% Bezier curve in green:
  \pscurve[linecolor=green,linewidth=2pt,%
    showpoints=true](5,5)(3,2)(4,4)(2,3)
  %% Circle in blue with radius 1:
  \pscircle[linecolor=blue,linestyle=dashed](3,2.5){1}
\end{pspicture}
[edit] Extensions
PSTricks commands are low level, so many LaTeX packages have been made in order to ease the creation of several kinds of graphics that are commonly used on mathematical typesetting.
pst-plot provides commands for creating function graphs. Consider the following example
\begin{pspicture*}(-7.5,-3)(7.5,3)
  \psaxes[labels=none](0,0)(-7,-2)(7,2)        % sets up axis
  \psplot[linecolor=blue, linewidth=1.5pt]%    % plots the sinewave
    {-7}{7}{x 0.01745329252 div sin}           % notice the RPN expression
  \uput[45](3.1415926,0){$\pi$}                % these are the labels
  \uput[90](-1.570796,0){$-\pi/2$}             % \uput is a box positioned at [angle]
  \uput[-90](1.570796,0){$\pi/2$}              % relative to (x,y) coordinate
  \uput[-135](-3.1415926,0){$-\pi$}            % and putting { content } on the box
  \psline[linewidth=1pt,linecolor=red,linestyle=dotted]%   % red dotted lines
    (1.57079632,1)(1.57079632,0)
  \psline[linewidth=1pt,linecolor=red,linestyle=dotted]%
    (-1.57079632,-1)(-1.57079632,0)
\end{pspicture*}

The previous example also illustrate that TeX commands can be used as elements into the pictures. Since PostScript uses RPN style for mathematical operations, the argument to pst-plot must be supplied in the same form.
pstricks-add extends pst-plot enabling also polar graphs and allowing the use algebraic notation for plots instead of RPN.
pst-math provides trigonometric functions in radians (since PostScript defaults to using degrees) and hyperbolic trigonometric functions.
pst-plot3d is used for creating 3D graphics like the following:
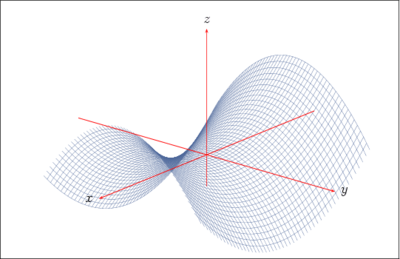
multido provides basic loop functionality for programming graphs with repeating elements:

pst-eucl is a beta extension for easy creation of geometrical drawings.

There are many other extensions, for drawing Circuit diagrams, barcodes, graphs, trees, visualizing data, etc.
[edit] See also
[edit] Further reading
- Herbert Voss; PSTricks – Grafik für TeX und LaTeX, 5th edition, DANTE and Lob.media, 912 pages, Heidelberg and Hamburg 2008, ISBN 3865412805.
[edit] External links
- The official PSTricks site.
- PSTricks documentation.
- PSTricks examples.
- pst-bezier, a PSTricks package
- LaTeXDraw, a free and open source graphical editor generating PSTricks code, written in Java.
- JPicEdt, another free and open source graphical editor generating PSTricks code, written in Java.

