Pivot table
From Wikipedia, the free encyclopedia
A pivot table is a data summarization tool found in data visualization programs such as spreadsheets (e.g. Microsoft Excel, OpenOffice.org Calc, Lotus 1-2-3). Among other functions, they can automatically sort, count, and total the data stored in one table or spreadsheet and create a second table displaying the summarized data. Pivot tables are also useful for quickly creating cross tabs. The user sets up and changes the summary's structure by dragging and dropping fields graphically. This "rotation" or pivoting of the summary table gives the concept its name. The term "pivot table" is a generic phrase used by multiple vendors. However, the specific form PivotTable is a trademark of the Microsoft Corporation.[1]
Contents |
[edit] History
The concept that led to today's pivot table came from Lotus Development Corporation's spreadsheet program Lotus Improv. Improv was envisioned in 1986 by Pito Salas, though it was not released until 1991. Salas realized that spreadsheets have patterns of data, and that designing a tool that could help the user recognize these patterns would make data analysis much more efficient. The grouping and aggregation feature Improv provided to fill this need is recognized as the original pivot table.[2]
A few months after Improv was first released on the NeXTStep platform, Brio Technology released a standalone Mac implementation called DataPivot.[3] Brio appears to have been the first company to use the term "pivot" to describe the concept. The DataPivot technology was purchased by Borland, who implemented it in their Quattro Pro spreadsheet; this was released in 1992, narrowly beating Lotus Improv for Windows to be the first spreadsheet to provide this functionality in the critical Windows market.
Today, many applications provide pivot tables or equivalent functionality, but the best-known modern implementation of the concept is in the dominant spreadsheet application, Microsoft Excel. Still, Excel's pivot tables are not as widely used as they might be; in a 2004 survey at Jelen's MrExcel.com, fewer than 42% of Excel users reported that they made full use of pivot tables.[4]
A pivot table can be graphically represented in a pivot chart.
[edit] Explanation of a pivot table
For typical data entry and storage, data is usually flat. Flat means that it consists of only columns and rows, such as in the following example:

While there is a lot of information stored in such data, it can be difficult to get summarized information. A pivot table can help quickly summarize the flat data, giving it depth, and get the desired information. The usage of a pivot table is extremely broad and depends on the situation. The first question to ask is, "what am I looking for?" In the example here, let us ask "How many Units did we sell in each Region for every Ship Date?":
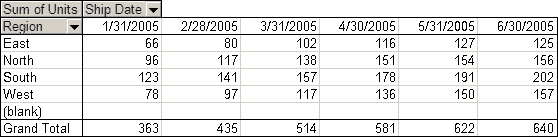
A pivot table usually consists of row, column, and data (or fact) fields. In this case, the row is Ship Date, the column is Region, and the data we would like to see is Units. These fields were dragged onto the pivot table from a list of available fields. Pivot tables also allow several kinds of aggregations including: sum, average, standard deviation, count, etc. In this case, we wanted to see the total number of units shipped, so we used a sum aggregation.
[edit] How a pivot table works
Using the example above, it will find all distinct records for Region. In this case, they are: North, South, East, West. Furthermore, it will find all distinct records for Ship Date. Based on the aggregation type, sum, it will summarize the fact, and display them in a multidimensional chart. In the example above, the first data point is 66. This number was obtained by finding all records where both Region was East and Ship Date was 1/31/2005, and adding the Units of that collection of records together to get a final result.
[edit] Application support
Pivot tables are now considered an integral part of a spreadsheet application. In addition to Microsoft Excel, competing software such as OpenOffice.org Calc provide similar functionality; the OpenOffice.org implementation is called DataPilot. Other companies such as numberGo and Quantrix provide similar implementations.
Pivot functionality is also provided in other data visualization tools, including business intelligence packages.
Google Docs allow the creation of basic pivot tables, via an application gadget, but the functionality is still very limited.
[edit] See also
[edit] References
- ^ Microsoft Trademarks
- ^ Alexander, Michael and Bill Jelen: Pivot Table Data Crunching (QUE, ISBN 0-7897-3435-4)
- ^ Wylie, Margie: "Data handling takes new turn with Brio manipulation utility", in MacWEEK, May 21, 1991. Summary accessed via accessmylibrary.com on September 24, 2007.
- ^ MrExcel.com "MrExcel quick poll". http://www.mrexcel.com/quickpoll.php?vo=2 MrExcel.com.
[edit] Further reading
- A Complete Guide to PivotTables: A Visual Approach (ISBN 1-59059-432-0) (in-depth review at slashdot.org)
- Excel 2007 PivotTables and PivotCharts: Visual blueprint (ISBN 978-0470132319)
- Pivot Table Data Crunching (Business Solutions) (ISBN 0-7897-3435-4)
- Beginning Pivot Tables in Excel 2007 (ISBN 1-59059-890-3)

