S&P 500
From Wikipedia, the free encyclopedia


The S&P 500 is a value weighted index published since 1957 of the prices of 500 large cap common stocks actively traded in the United States. The stocks included in the S&P 500 are those of large publicly held companies that trade on either of the two largest American stock markets, the New York Stock Exchange and NASDAQ. Almost all of the stocks included in the index are among the 500 American stocks with the largest market capitalizations.
After the Dow Jones Industrial Average, the S&P 500 is the most widely followed index of large-cap American stocks. It is considered a bellwether for the American economy, and is included in the Index of Leading Indicators. Some mutual funds, exchange traded funds, and other managed funds, such as pension funds, are designed so as to mimic the performance of the S&P 500 index. Hundreds of billions of US dollars have been invested in this fashion.
The index is the best known of the many indices owned and maintained by Standard & Poor's, a division of McGraw-Hill. S&P 500 refers not only to the index, but also to the 500 companies that have their common stock included in the index. The ticker symbol for the S&P 500 index varies. Some examples of the symbol are ^GSPC[1], .INX[2], and $SPX[3]. The stocks included in the S&P 500 index are also part of the broader S&P 1500 and S&P Global 1200 stock market indices.
Contents |
[edit] Selection
The components of the S&P 500 are selected by committee. This is similar to the Dow 30, but different from others such as the Russell 1000, which are strictly rules-based.
The index does include a handful (9 as of March 26, 2009) of non-U.S. companies. This group includes both formerly U.S. companies that have reincorporated outside the United States, as well as firms that have never been incorporated in the United States.
The committee selects the companies in the S&P 500 so they are representative of various industries in the United States economy. In addition, companies that do not trade publicly (such as those that are privately or mutually held) and stocks that do not have sufficient liquidity are not in the index. For example, Berkshire Hathaway has a market capitalization larger than nearly all members of the S&P 500, but its extremely high stock price (over $80,000 as of March 2009[4]) makes it very difficult to trade and so Berkshire is excluded from the index. By contrast, the Fortune 500 attempts to list the 500 largest public companies in the United States by gross revenue, regardless of whether their stocks trade or their liquidity, without adjustment for industry representation, and excluding companies incorporated outside the United States.
[edit] Listed companies
[edit] Versions
The "S&P 500" generally quoted is a price return index; there are also total return and net total return versions of the index. These versions differ in how dividends are accounted for. The price return version does not account for dividends -- it only captures the changes in the prices of the index components. The total return version reflects the effects of dividend reinvestment. Finally, the net total return version reflects the effects of dividend reinvestment after the deduction of withholding tax.[5][6]
[edit] Weighting
The index has traditionally been market-value weighted; that is, movements in the prices of stocks with higher market capitalizations (the share price times the number of shares outstanding) have a greater effect on the index than companies with smaller market caps.
The index is now float weighted. That is, Standard & Poor's now calculates the market caps relevant to the index using only the number of shares (called "float") available for public trading. This transition was made in two steps, the first on March 18, 2005 and the second on September 16, 2005. (For example, only the Class A shares of Google ("GOOG") are publicly traded; thus, of the 207,096,000 total shares outstanding as of March 2006, only the 199,570,000 Class A shares were considered float, so only the value of the latter number of shares was used to incorporate Google into the S&P 500 on March 31, 2006.) Only a minority of companies in the index have a float value that is lower than their total capitalization. For most companies in the index S&P considers all shares to be part of the public float and thus the capitalization used in the index calculation equals the market capitalization for those companies.
[edit] Index Maintenance
In order to keep the S&P 500 Index comparable across time, the index needs to take into account corporate actions such as stock splits, share issuance, dividends and restructuring events (such as merger or spinoffs). Additionally, in order to keep the Index reflective of American stocks, the constituent stocks need to be changed from time to time.
To prevent the value of the Index from changing merely as a result of corporate financial actions, all such actions affecting the market value of the Index require a Divisor adjustment. Also, when a company is dropped and replaced by another with a different market capitalization, the divisor needs to be adjusted in such a way that the value of the S&P 500 Index remains constant. All Divisor adjustments are made after the close of trading and after the calculation of the closing value of the S&P 500 Index.
| Type of Action | Divisor Adjustment |
| Stock Split (e.g. 2x1) | No |
| Share Issuance | Yes |
| Share Repurchase | Yes |
| Special Cash Dividend | Yes |
| Company Change | Yes |
| Rights offering | Yes |
| Spinoffs | Yes |
| Mergers | Yes |
[edit] Investing
Many index funds and exchange-traded funds attempt to replicate (before fees and expenses) the performance of the S&P 500 by holding the same stocks as the index, in the same proportions. Consequently, a company whose stock is added to the list of S&P 500 stocks may see its stock price rise, as the managers of index funds must purchase that company's stock in order to continue tracking the S&P 500 index. Several mutual fund managers also provide index funds that track the S&P 500, the first of which was the The Vanguard Group's Vanguard 500 in 1976.[7] Many retirement plans offer such funds. For example, the Thrift Savings Plan's C Fund tracks the total return S&P 500 index.
In addition to investing in a mutual fund indexed to the S&P 500, investors may also purchase shares of an exchange-traded fund (ETF) which represents ownership in a portfolio of the equity securities that comprise the Standard & Poor's 500 Index. One of these ETF's is called the Standard & Poor's Depositary Receipts (SPDRs, pronounced "spiders"), and is issued by SSgA State Street Global Advisors; (Symbol:SPY). Typical volume for the SPY SPDR averages between 300-400 million shares per day; the highest of any US stock traded on any exchange. On October 10, 2008, trading volume for the SPY SPDR surpassed 871 million shares; with a closing price of $88.50, the monetary value of traded shares which changed hands exceeded an astounding 77 billion dollars for the day.[8] Barclays Global Investors offers the iShares S&P 500 (Symbol:IVV), which is similar to the SPDRs, but is structured differently. Both the SPDRs and the iShares have a management expense ratio of under 0.1% a year; making them an efficient proxy for the underlying index, while achieving a performance close to the S&P 500 (minus fees and expenses). Rydex also offers an ETF, S&P Equal Weight (Symbol:RSP), which provides equal exposure to all the companies in the S&P 500. In addition, Rydex offers other related S&P 500 index ETFs such as the 2x (Symbol:RSU), which attempts to match the daily performance of the S&P 500 by 200% and the inverse 2x (Symbol:RSW), which attempts to match the inverse daily performance by 200%. More heavily traded ProShares issued by ProFunds offer inverse performance (Symbol:SH), inverse 2x performance (Symbol:SDS), and 2x performance (Symbol:SSO).
The advantages of having inverse and 2x performance ETFs tied to the S&P 500; allow an investor to benefit from having a bearish strategy on the index without selling short, or in the case of 2x performance, increases the buying power by leveraging money without using margin. Of course, short selling and buying as well as shorting on margin, are allowed and made accessible; but of which some typical investment companies such as mutual funds, would probably either discourage or forbid. In regard to using margin on a 2x performance ETF, that would result in leveraging an investment by 400%. Although it may substantially increase the profit on an investment, it would however also expose an investor to a potential loss risk four times as great and possibly result in a margin call four times as fast.
In the derivatives market, the Chicago Mercantile Exchange (CME) offers futures contracts that can be traded on the exchange floor in an open outcry auction, or on CME's Globex platform, and are the exchange's most popular product. Additionally, the Chicago Board Options Exchange (CBOE) offers options on the S&P 500 Index as well as S&P 500 ETFs, inverse ETFs and leveraged ETFs.
[edit] Market Statistics
[edit] Records (a)
|
[edit] Total Annual Returns (b)
|
- (a) These are the closing milestones of the price return S&P 500 in 100-point increments, along with the all-time highs.
- (b) Total returns including reinvested dividends, in percent. In other words, these are the changes in the total return version of the index.
[edit] History
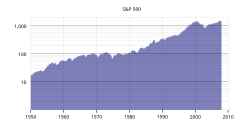
Standard & Poor's introduced its first stock index in 1923. Before 1957, its primary daily stock market index was the "S&P 90," a value weighted index based on 90 stocks. By linking this index to the S&P 500 index, the latter has been extended back to 1918. Standard & Poor's also published a weekly index of 423 companies. The S&P 500 index in its present form began on March 4, 1957. Thanks to the computer technology emerging at the time, this index could be calculated and disseminated in real time. The S&P 500 is widely employed as a measure of the general level of stock prices, as it includes both growth stocks and the generally less volatile value stocks, and stocks listed on NASDAQ as well as the NYSE,
The index reached an all-time intraday high of 1,552.87 in trading on March 24, 2000, and then lost approximately 50% of its value in a two-year bear market, spiking below 800 points in July 2002 and reaching a low of 768.63 intraday on October 10, 2002. The S&P 500 remained below its year 2000 all-time high somewhat longer than the popular Dow Jones Industrial Average and the more comprehensive Wilshire 5000. However, on May 30, 2007, the S&P 500 closed at 1,530.23 to set its first all-time closing high in more than seven years and set a new intra-day record of 1,555.10 on July 21, 2007, its first of the 21st century.
In mid-2007, difficulties stemming from subprime mortgage lending began spreading to the wider financial sector, resulting in the second bear market of the 21st century. The resulting crisis became acute in September 2008, ushering in a period of unusual volatility, encompassing record 100-point moves in both directions and reaching the highest levels since 1929. [9] On November 20, 2008, the index closed at 752.44, its lowest close since early 1997.[10] A modest recovery the following day still left the index down 45.5% for the year. This year-to-date loss was the greatest since 1931, when the broad market declined more than 50%.[11] Although total losses during the Great Depression, exceeded 80% over a three-year period. 2009 saw a return to a declining market with 12 year lows being made during March. The index closed at 676.53 on March 09, 2009.
[edit] See also
- List of S&P 500 companies
- Fortune 500
- FTSE 100
- S&P 400
- S&P 600
- S&P 1500
- E-mini S&P
- Index fund
- Exchange-traded fund
- Wikinvest:S&P 500
[edit] References
- ^ "Yahoo! Finance: ^GSPC". http://finance.yahoo.com/q?s=^GSPC.
- ^ "Google Finance: .INX". http://finance.google.com/finance?q=INDEXSP:.INX.
- ^ "MarketWatch: $SPX". http://www.marketwatch.com/quotes/$spx.
- ^ NYSE:BRK-A daily prices from Yahoo! Finance
- ^ "S&P - Indices > Equity Indices - S&P 500 - Index Table". http://www2.standardandpoors.com/portal/site/sp/en/us/page.topic/indices_500/2,3,2,2,0,0,0,0,0,0,0,0,0,0,0,0.html.
- ^ "Description". http://www2.standardandpoors.com/servlet/ContentServer?pagename=spcom/template/topic_template/DescriptionPglt&r=US&l=EN&ds=indices_totalreturn.
- ^ "Investopedia Vanguard Profile". http://www.investopedia.com/university/greatest/johnbogle.asp.
- ^ AMEX:SPY daily prices for the week of October 6, 2008 from Yahoo! Finance
- ^ S&P 500 actual volatility at highest since 1929
- ^ Stocks Plunge, Leaving Dow Below 7600
- ^ Sommer, Jeff (2008-11-23). "A Friday Rally Can't Save the Week". The New York Times.
[edit] External links
- Overview of the S&P 500 from Standard & Poor's
- List of companies in the S&P 500
- List of S&P 500 companies by percentage weight
- S&P 500 Fact Sheet (PDF Format)
- Logarithmic Chart of S&P 500 (1950-present) at Yahoo! Finance
|
|||||

