Earned value management
From Wikipedia, the free encyclopedia
Earned Value Management (EVM) is a project management technique for measuring project progress in an objective manner. EVM has the unique ability to combine measurements of scope, schedule, and cost in a single integrated system. When properly applied, EVM provides an early warning of performance problems. Additionally, EVM promises to improve the definition of project scope, prevent scope creep, communicate objective progress to stakeholders, and keep the project team focused on achieving progress.
Contents |
[edit] Introduction to EVM
Essential features of any EVM implementation include
- a project plan that identifies work to be accomplished,
- a valuation of planned work, called Planned Value (PV) or Budgeted Cost of Work Scheduled (BCWS), and
- pre-defined “earning rules” (also called metrics) to quantify the accomplishment of work, called Earned Value (EV) or Budgeted Cost of Work Performed (BCWP), .
EVM implementations for large or complex projects include many more features, such as indicators and forecasts of cost performance (over budget or under budget) and schedule performance (behind schedule or ahead of schedule). However, the most basic requirement of an EVM system is that it quantifies progress using PV and EV.
[edit] Project Tracking without EVM


It is helpful to see an example of project tracking that does not include earned value performance management. Consider a project that has been planned in detail, including a time-phased spend plan for all elements of work. Figure 1 shows the cumulative budget for this project as a function of time (the blue line, labeled PV). It also shows the cumulative actual cost of the project (red line) through week 8. To those unfamiliar with EVM, it might appear that this project was over budget through week 4 and then under budget from week 6 through week 8. However, what is missing from this chart is any understanding of how much work has been accomplished during the project. If the project was actually completed at week 8, then the project would actually be well under budget and well ahead of schedule. If, on the other hand, the project is only 10% complete at week 8, the project is significantly over budget and behind schedule. A method is needed to measure technical performance objectively and quantitatively, and that is what EVM accomplishes
[edit] Project Tracking with EVM
Consider the same project, except this time the project plan includes pre-defined methods of quantifying the accomplishment of work. At the end of each week, the project manager identifies every detailed element of work that has been completed, and sums the PV for each of these completed elements. Earned value may be accumulated monthly, weekly, or as progress is made.
[edit] Earned Value (EV)
Figure 2 shows the EV curve (in green) along with the PV curve from Figure 1. The chart indicates that technical performance (i.e., progress) started more rapidly than planned, but slowed significantly and fell behind schedule at week 7 and 8. This chart illustrates the schedule performance aspect of EVM. It is complementary to critical path or critical chain schedule management.
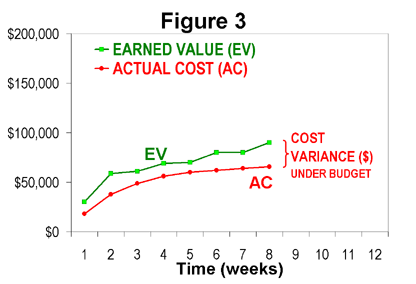
Figure 3 shows the same EV curve (green) with the actual cost data from Figure 1 (in red). It can be seen that the project was actually under budget, relative to the amount of work accomplished, since the start of the project. This is a much better conclusion than might be derived from Figure 1.
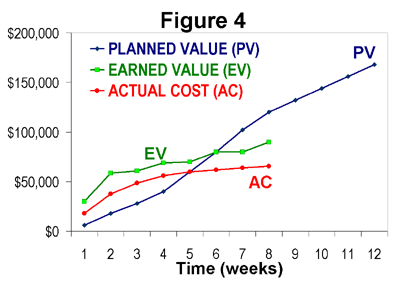
Figure 4 shows all three curves together – which is a typical EVM line chart. The best way to read these three-line charts is to identify the EV curve first, then compare it to PV (for schedule performance) and AC (for cost performance). It can be seen from this illustration that a true understanding of cost performance and schedule performance relies first on measuring technical performance objectively. This is the foundational principle of EVM.
[edit] History of EVM
EVM emerged as a financial analysis specialty in United States Government programs in the 1960s, but it has since become a significant branch of project management and cost engineering. Project management research investigating the contribution of EVM to project success suggests a moderately strong positive relationship [4]. Implementations of EVM can be scaled to fit projects of all sizes and complexity.
The genesis of EVM was in industrial manufacturing at the turn of the 20th century, based largely on the principle of "earned time" popularized by Frank and Lillian Gilbreth [1] but the concept took root in the United States Department of Defense in the 1960s. The original concept was called PERT/COST, but it was considered overly burdensome (not very adaptable) by contractors who were mandated to use it, and many variations of it began to proliferate among various procurement programs. In 1967, the DoD established a criterion-based approach, using a set of 35 criteria, called the Cost/Schedule Control Systems Criteria (C/SCSC). In 1970s and early 1980s, a subculture of C/SCSC analysis grew, but the technique was often ignored or even actively resisted by project managers in both government and industry. C/SCSC was often considered a financial control tool that could be delegated to analytical specialists.
In the late 1980s and early 1990s, EVM emerged as a project management methodology to be understood and used by managers and executives, not just EVM specialists. In 1989, EVM leadership was elevated to the Undersecretary of Defense for Acquisition, thus making EVM an essential element of program management and procurement. In 1991, Secretary of Defense Dick Cheney canceled the Navy A-12 Avenger II Program due to performance problems detected by EVM. This demonstrated conclusively that EVM mattered to secretary-level leadership. In the 1990s, many U.S. Government regulations were eliminated or streamlined. However, EVM not only survived the acquisition reform movement, but became strongly associated with the acquisition reform movement itself. Most notably, from 1995 to 1998, ownership of EVM criteria (reduced to 32) were transferred to industry by adoption of ANSI EIA 748-A standard[5].
EVM was not limited to the DoD for long. It was quickly adopted by the National Aeronautics and Space Administration, United States Department of Energy and other technology-related agencies. Many industrialized nations also began to utilize EVM in their own procurement programs. The construction industry was an early commercial adopter of EVM. Closer integration of EVM with the practice of project management accelerated in the 1990s. There are two primary professional associations for EVM, one, called the Performance Management Association merged with the Project Management Institute (PMI) in 1999 to become PMI’s first college, the College of Performance Management. The second is the Association for the Advancement of Cost Engineering International AACEi) AACE has developed a professional credential, the Earned Value Professional EVP)[2] which attests to minimum level of knowledge and some demonstrated skills as a practitioner. An overview of EVM was included in first PMBOK Guide First Edition in 1987 and expanded in subsequent editions. Efforts to simplify and generalize EVM gained momentum in the early 2000s. The United States Office of Management and Budget began to mandate the use of EVM across all government agencies, and for the first time, for certain internally-managed projects (not just for contractors). EVM also received greater attention by publicly traded companies in response to the Sarbanes-Oxley Act of 2002.
[edit] Scaling EVM from Simple to Advanced Implementations
The foundational principle of EVM, mentioned above, does not depend on the size or complexity of the project. However, the implementations of EVM can vary significantly depending on the circumstances. In many cases, organizations establish an all-or-nothing threshold; projects above the threshold require a full-featured (complex) EVM system and projects below the threshold are exempted. Another approach that is gaining favor is to scale EVM implementation according to the project at hand and skill level of the project team. [6] [7]
[edit] Simple Implementations (emphasizing only technical performance)
There are many more small and simple projects than there are large and complex ones, yet historically only the largest and most complex have enjoyed the benefits of EVM. Still, lightweight implementations of EVM are achievable by any person who has basic spreadsheet skills. In fact, spreadsheet implementations are an excellent way to learn basic EVM skills.
The first step is to define the work. This is typically done in a hierarchical arrangement called a work breakdown structure (WBS) although the simplest projects may use a simple list of tasks. In either case, it is important that the WBS or list be comprehensive. It is also important that each element be mutually exclusive, so that work is easily categorized in one and only one element of work. The most detailed elements of a WBS hierarchy (or the items in a list) are called terminal elements of work.
The second step is to assign a value, called planned value (PV), to each terminal element. For large projects, PV is almost always an allocation of the total project budget, and may be in units of currency (e.g. dollars or euros) or in labor hours, or both. However, in very simple projects, each terminal element may be assigned a weighted “point value" which might not be a budget number. Assigning weighted values and achieving consensus on all PV quantities yields an important benefit of EVM, because it exposes misunderstandings and miscommunications about the scope of the project, and resolving these differences should always occur as early as possible. Some terminal elements can not be known (planned) in great detail in advance, and that is expected, because they can be further refined at a later time.
The third step is to define “earning rules” for each terminal element. The simplest method is to apply just one earning rule, such as the 0/100 rule, to all terminal elements. Using the 0/100 rule, no credit is earned for an element of work until it is finished. A related rule is called the 50/50 rule, which means 50% credit is earned when an element of work is started, and the remaining 50% is earned upon completion. Other fixed earning rules such as a 25/75 rule or 20/80 rule are gaining favor, since they assign more weight to finishing work than for starting it, but they also motivate the project team to identify when an element of work is started, which can improve awareness of work-in-progress. These simple earning rules work well for small or simple projects because generally each terminal element tends to be fairly short in duration.
These initial three steps define the minimal amount of planning for simplified EVM. The final step is to execute the project according to the plan and measure forward progress. When terminal elements are started and/or finished, EV is accumulated according to the earning rule. This is typically done at regular intervals (e.g. weekly or monthly), but there is no reason why EV cannot be accumulated in near real-time, when work elements are started/completed. In fact, waiting to update EV only once per month (simply because that is when cost data are available) only detracts from a primary benefit of using EVM, which is to create a technical performance scoreboard for the project team.

In a lightweight implementation such as described here, the project manager has not accumulated cost nor defined a detailed project schedule network (i.e. using a critical path or critical chain methodology). While such omissions are inappropriate for managing large projects, they are a common and reasonable occurrence in many very small or simple projects. Any project can benefit from using EV alone as a real-time score of forward progress. One useful result of this very simple approach (without schedule models and actual cost accumulation) is to compare EV curves of similar projects, as illustrated in Figure 5. In this example, the progress of three residential construction projects are compared by aligning the starting dates. If these three home construction projects were measured with the same PV valuations, the relative schedule performance of the projects can be easily compared.
[edit] Intermediate Implementations (integrating technical and schedule performance)
In many projects, schedule performance (completing the work on time) is equal in importance to technical performance. For example, some new product development projects place a high premium on finishing quickly. It is not that cost is unimportant, but finishing after a competitor may cost a great deal more in lost market share. It is likely that these kinds of projects will not use the lightweight version of EVM described in the previous section, since there is no planned timescale for measuring schedule performance. A second layer of EVM skill can be very helpful in managing the schedule performance of these “intermediate” projects. The project manager may employ a critical path or critical chain to build a project schedule model. As in the lightweight implementation, the project manager must define the work comprehensively, typically in a WBS hierarchy. He/she will construct a project schedule model that describes the precedence links between elements of work. This schedule model can then be used to develop the PV curve (or baseline), as shown in Figure 2'.
It should be noted that measuring schedule performance using EVM does not replace the need to understand schedule performance in terms of the project's schedule model (precedence network). However, EVM schedule performance, as illustrated in Figure 2 provides an additional indicator -- one that can be communicated in a single chart. Although it is theoretically possible that detailed schedule analysis will yield different conclusions than broad schedule analysis, in practice there tends to be a high correlation between the two. Although EVM schedule measurements are not necessarily conclusive, they provide useful diagnostic information.
In intermediate and advanced EVM implementations, many more earning rules are commonly used. Earning rules in addition to the 0/100, 50/50 and 25/75 "fixed formulas" mentioned above include weighted milestones, percent complete estimates, equivalent units, earned standards, apportioned effort, and level of effort (LOE). The relative strengths and weaknesses of these rules are beyond the scope of this article. Their implementation usually requires software tools more capable than spreadsheets.
Although such intermediate implementations do not require units of currency (e.g. dollars), it is common practice to use budgeted dollars as the scale for PV and EV. It is also common practice to track labor hours in parallel with currency. The following EVM formulas are for schedule management, and do not require accumulation of actual cost (AC). This is important because it is not uncommon in small and intermediate size projects for true costs to be unknown or unavailable.
- Schedule Variance (SV)
- EV-PV greater than 0 is good (ahead of schedule)
- Schedule Performance Index (SPI)
- EV/PV greater than 1 is good (ahead of schedule)
- See also Earned Schedule for a description of known limitations in SV and SPI formulas and an emerging practice for correcting these limitations.
[edit] Advanced Implementations (integrating cost, schedule and technical performance)
In addition to managing technical and schedule performance, large and complex projects require that cost performance is monitored and reviewed at regular intervals. To measure cost performance, planned value (or BCWS - Budgeted Cost of Work Scheduled) and earned value (or BCWP - Budgeted Cost of Work Performed) must be in units of currency (the same units that actual costs are measured.) In large implementations, the planned value curve is commonly called a Performance Measurement Baseline (PMB) and may be arranged in control accounts, summary-level planning packages, planning packages and work packages. In large projects, establishing control accounts is the primary method of delegating responsibility and authority to various parts of the performing organization. Control accounts are cells of a responsibility assignment matrix, which is intersection of the project WBS and the organizational breakdown structure (OBS). Control accounts are assigned to Control Account Managers (CAMs). Large projects require more elaborate processes for controlling baseline revisions, more thorough integration with subcontractor EVM systems, and more elaborate management of procured materials.
In the United States, the primary standard for full-featured EVM systems is the ANSI/EIA-748A standard, published in May 1998 and reaffirmed in August 2002. The standard defines 32 criteria for full-featured EVM system compliance. As of the year 2007, a draft of ANSI/EIA-748B, a revision to the original is available from ANSI. Other countries have established similar standards.
In addition to using BCWS and BCWP, prior to 1998 implementations often use the term Actual Cost of Work Performed (ACWP) instead of AC. Additional acronyms and formulas include:
- Budget at Completion (BAC): The total planned value (PV or BCWS) at the end of the project. If a project has a Management Reserve (MR), it is typically in addition to the BAC.
- Cost Variance (CV)
- EV - AC, greater than 0 is good (under budget)
- Cost Performance Index (CPI)
- EV/AC, greater than 1 is good (under budget)
- < 1 means that the cost of completing the work is higher than planned (bad)
- = 1 means that the cost of completing the work is right on plan (good)
- > 1 means that the cost of completing the work is less than planned (good or sometimes bad).
- Having a CPI that is very high (in some cases, very high is only 1.2) may mean that the plan was too conservative, and thus a very high number may in fact not be good, since the CPI is being measured against a poor baseline. Management or the customer may be upset with the planners since an overly conservative baseline ties up available funds for other purposes, and the baseline is also used for manpower planning.
- Estimate At Completion (EAC)
- EAC is the manager's projection of total cost of the project at completion.

- ETC is the estimate to complete the project.

- To-Complete Performance Index (TCPI)
- The To Complete Performance Index (TCPI) provides a projection of the anticipated performance required to achieve either the BAC or the EAC. TCPI indicates the future required cost efficiency needed to achieve a target EAC (Estimate At Complete). Any significant difference between TCPI and the CPI needed to meet the EAC should be accounted for by management in their forecast of the final cost..

- Independent Estimate At Completion (IEAC)
- The IEAC is a metric to project total cost using the performance to date to project overall performance. This can be compared to the EAC, which is the manager's projection.

- or
[edit] Limitations of EVM
EVM has no provision to measure project quality, so it is possible for EVM to indicate a project is under budget, ahead of schedule and scope fully executed, but still have unhappy clients and ultimately unsuccessful results. In other words, EVM is only one tool in the project manager's toolbox.
Since EVM requires quantification of a project plan, it is often perceived to be inapplicable to discovery-driven or Agile software development projects. For example, it may be impossible to plan certain research projects far in advance, since research itself uncovers some opportunities (research paths) and actively eliminates others. However, another school of thought holds that all work can be planned, even if in weekly timeboxes or other short increments. Thus, the challenge is to create agile or discovery-driven implementations of the EVM principle, and not simply to reject the notion of measuring technical performance objectively. (See the lightweight implementation for small projects, described above). Applying EVM in fast-changing work environments is, in fact, an area of project management research.[8]
Traditional EVM is not intended for non-discrete (continuous) effort. In traditional EVM standards, non-discrete effort is called “level of effort" (LOE). If a project plan contains a significant portion of LOE, and the LOE is intermixed with discrete effort, EVM results will be contaminated. This is another area of EVM research.
Traditional definitions of EVM typically assume that project accounting and project network schedule management are prerequisites to achieving any benefit from EVM. Many small projects don't satisfy either of these prerequisites, but they too can benefit from EVM, as described for simple implementations, above. Other projects can be planned with a project network, but do not have access to true and timely actual cost data. In practice, the collection of true and timely actual cost data can be the most difficult aspect of EVM. Such projects can benefit from EVM, as described for intermediate implementations, above, and Earned Schedule.
[edit] See also
[edit] Notes and References
- ^ Defense Systems Management College (1997). Earned Value Management Textbook, Chapter 2. Defense Systems Management College, EVM Dept., 9820 Belvoir Road, Fort Belvoir, VA 22060-5565.
- ^ Abba, Wayne (2000-04-01). "How Earned Value Got to Prime Time: A Short Look Back and a Glance Ahead". PMI College of Performance Management (www.pmi-cpm.org). http://www.pmi-cpm.org/members/library/EVLook%20Back-Glance%20Ahead.abba.pdf. Retrieved on 2006-10-31.
- ^ Fleming, Quentin; Joel Koppelman (2005). Earned Value Project Management (Third Edition ed.). Project Management Institute. ISBN 1-930699-89-1.
- ^ Marshall, Robert A. (2006-11-09). "The contribution of earned value management to project success on contracted efforts: A quantitative statistics approach within the population of experienced practitioners". PMI (www.pmi.org). http://www.pmi.org/PDF/pp_marshall.pdf. Retrieved on 2006-11-09.
- ^ ANSI EIA-748A Standard (June1998 ed.). Electronic Industries Alliance. 1998.
- ^ Sumara, Jim; John Goodpasture (1997-09-29). "Earned Value -- The Next Generation -- A Practical Application for Commercial Projects". http://www.sqpegconsulting.com/EV_Chi_97NP03.PDF. Retrieved on 2006-10-26.
- ^ Goodpasture, John C. (2004). Quantitative Methods in Project Management. J. Ross Publishing. pp. 173–178. ISBN 1-932159-15-0.
- ^ Sulaiman, Tamara (2007-01-08). "AgileEVM -- Earned Value Management The Agile Way". Agile Journal. http://www.agilejournal.com/content/view/210/. Retrieved on 2007-03-07.
[edit] External links
- The Top 10 Secrets of Earned Value Management
- US DoD Earned value management website
- The Acquisition Community Connection on EVM
- EVM at NASA
- EVM in the Australian Department of Defence
- UK MoD on-line training using Flash player
- Start With "Simple" Earned Value On All Your Projects
- Questioning Earned Value Management on IT Projects

