Keeling Curve
From Wikipedia, the free encyclopedia
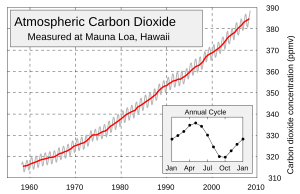
The Keeling Curve is a graph showing the variation in concentration of atmospheric carbon dioxide since 1958. It is based on continuous measurements taken at the Mauna Loa Observatory in Hawaii under the supervision of Charles David Keeling. Keeling's measurements showed the first significant evidence of rapidly increasing carbon dioxide levels in the atmosphere. Many scientists credit Keeling's graph with first bringing the world's attention to the effects that human activity were having on the Earth's atmosphere and climate.[1]
Charles David Keeling of the Scripps Institution of Oceanography at UC San Diego was the first person to make frequent regular measurements of the atmospheric carbon dioxide (CO2) concentration, taking readings at the South Pole and in Hawaii from 1958 onwards.[2] Due to funding cuts in the mid-1960s, Keeling was forced to abandon continuous monitoring efforts at the South Pole, but he scraped together enough money to maintain operations at Mauna Loa, which have continued to the present day.[3]
The measurements collected at Mauna Loa show a steady increase in mean atmospheric CO2 concentration from about 315 parts per million by volume (ppmv) in 1958 to 385 ppmv as of June 2008.[4][5] This increase in atmospheric CO2 is considered to be largely due to the combustion of fossil fuels, and has been accelerating in recent years. Since carbon dioxide is a greenhouse gas, this has significant implications for global warming. Measurements of carbon dioxide concentration in ancient air bubbles trapped in polar ice cores show that mean atmospheric CO2 concentration has historically been between 275 and 285 ppmv during the Holocene epoch (9,000 BCE onwards), but started rising sharply at the beginning of the nineteenth century.[6] However, analyses of stomatal frequency in tree leaves indicate that mean atmospheric CO2 concentration may have reached 320 ppmv during the Medieval Warm Period (800–1300 CE) and 350 ppmv during the early Holocene.[7][8]
Though Mauna Loa is an active volcano, Keeling and collaborators made measurements on the incoming ocean breeze and above the thermal inversion layer to minimize local contamination from volcanic vents. In addition, the data is normalized to negate any influence from local contamination.[9] Measurements at many other isolated sites have confirmed the long-term trend shown by the Keeling Curve,[10] though no sites have a record as long as Mauna Loa.[11]
The Keeling Curve also shows a cyclic variation of about 5 ppmv in each year corresponding to the seasonal change in uptake of CO2 by the world's land vegetation. Most of this vegetation is in the Northern hemisphere, since this is where most of the land is located. The level decreases from northern spring onwards as new plant growth takes carbon dioxide out of the atmosphere through photosynthesis and rises again in the northern fall as plants and leaves die off and decay to release the gas back into the atmosphere.[12]
Due in part to the significance of Keeling's findings,[3] the NOAA began monitoring CO2 levels worldwide in the 1970s. Today, CO2 levels are monitored at about 100 sites around the globe.[1]
Keeling died in 2005. Supervision of the measuring project was taken over by his son, Ralph Keeling, a climate science professor at the Scripps Institution.[13]
[edit] References
- ^ a b Briggs, Helen (December 1, 2007). "50 years on: The Keeling Curve legacy". BBC News. http://news.bbc.co.uk/2/hi/science/nature/7120770.stm.
- ^ Rose Kahele (October/November 2007). "Behind the Inconvenient Truth". Hana Hou! vol. 10, No. 5. http://www.hanahou.com/pages/Magazine.asp?Action=DrawArticle&ArticleID=616&MagazineID=39.
- ^ a b Keeling, Charles D. (1998). "Rewards and Penalties of Monitoring the Earth." Annual Review of Energy and the Environment 23: 25-82.
- ^ Trends in Atmospheric Carbon Dioxide - Mauna Loa. National Oceanic & Atmospheric Administration.
- ^ Globally averaged marine surface monthly mean data. National Oceanic & Atmospheric Administration.
- ^ Neftel, A.; Moor, E.; Oeschger, H.; Stauffer, B. (1985). "Evidence from polar ice cores for the increase in atmospheric CO2 in the past two centuries". Nature 315: 45–47. doi:.
- ^ Kouwenberg, Lenny; et al. (2005). "Atmospheric CO2 fluctuations during the last millennium reconstructed by stomatal frequency analysis of Tsuga heterophylla needles". Geology 33 (1): 33–36. doi:.
- ^ Wagner, Friederike; et al. (1999). "Century-Scale Shifts in Early Holocene Atmospheric CO2 Concentration". Science 284 (5422): 1971–1973. doi:.
- ^ Keeling, Charles D. (1978). "The Influence of Mauna Loa Observatory on the Developm ent of Atmospheric CO2 Research". In Mauna Loa Observatory: A 20th Anniversary Report. (National Oceanic and Atmospheric Administration Special Report, September 1978), edited by John Miller, pp. 36-54. Boulder, CO: NOAA Environmental Research Laboratories.
- ^ Global Stations CO2 Concentration Trends. Scripps CO2 Program.
- ^ C.D. Keeling and T.P. Whorf (October 2004). "Atmospheric CO2 from Continuous Air Samples at Mauna Loa Observatory, Hawaii, U.S.A.". Carbon Dioxide Information Analysis Center, Oak Ridge National Laboratory. http://cdiac.ornl.gov/trends/co2/sio-keel-flask/sio-keel-flaskmlo_c.html.
- ^ http://earthguide.ucsd.edu/globalchange/keeling_curve/01.html Keeling Curve, 2002, University of California, San Diego
- ^ Manier, Jeremy (March 30, 2008), "Researcher's work, at 50, still points to 'inconvenient truth'", Chicago Tribune, http://www.chicagotribune.com/news/local/chi-keeling_bd30mar30,1,376094.story
[edit] External links
- Climate Change Is Clear Atop Mauna Loa, NPR, Day to Day, May 1, 2007
- Scripps Institution of Oceanography CO2-Program: Home of the Keeling Curve
- Earthguide educational resource
- The Keeling Curve Turns 50 - Scripps Institution of Oceanography
|
||||||||||||||||||||||||||||||||||||||||||||||||||||||||||||||||||||||||||||||||||||||||||

