The Bell Curve
From Wikipedia, the free encyclopedia
|
|
The neutrality of this article is disputed. Please see the discussion on the talk page. Please do not remove this message until the dispute is resolved. (February 2009) |
|
|
It has been suggested that Intelligence: Knowns and Unknowns be merged into this article or section. (Discuss) |
| The Bell Curve | |
 |
|
| Author | Richard J. Herrnstein, Charles Murray |
|---|---|
| Publisher | Free Press |
| Publication date | September 1994 |
| Media type | hardcover |
| Pages | 845 |
| ISBN | ISBN 0-02-914673-9 |
The Bell Curve is a controversial, best-selling 1994 book by the late Harvard psychologist Richard J. Herrnstein and American Enterprise Institute political scientist Charles Murray. Its central point is that intelligence is a better predictor of many factors including financial income, job performance, unwed pregnancy, and crime than parents' socioeconomic status or education level. Also, the book argues that those with high intelligence, which it called the "cognitive elite", are becoming separated from the general population of those with average and below-average intelligence and that this is a dangerous social trend. Much of the controversy concerns Chapters 13 and 14, in which the authors wrote about the enduring racial differences in intelligence and discuss implications of those differences. The authors were reported throughout the popular press as arguing that these IQ differences are genetic, and they did indeed write in chapter 13: "It seems highly likely to us that both genes and the environment have something to do with racial differences." The introduction to the chapter more cautiously states, "The debate about whether and how much genes and environment have to do with ethnic differences remains unresolved."
The book draws heavily from mainstream science research. However, their analysis is their own. Though Richard Herrnstein had a strong background in psychology, co-author Charles Murray was not an expert in intelligence testing.[1]
The book's title comes from the bell-shaped normal distribution of IQ scores. The normal distribution is the limiting distribution of a random quantity which is the sum of smaller, independent random phenomena. The message in the title is that IQ scores are normally distributed because a person's intelligence is the sum of many small random variations in genetic and environmental factors.
Shortly after publication, many people rallied both in criticism and defense of the book. Some critics denounced the book and its authors as supporting scientific racism. A number of critical texts, including The Bell Curve Debate, were written in response to the book.
Contents |
[edit] Content
The Bell Curve contains 941 pages in the first printing and 879 in the revised paperback. Much of its material is technical and academic. The book's statistical explanations are styled to appeal to a general audience. There are extensive notes, graphs, and tables.
The Bell Curve is divided into four sections.
- Part I argues that social stratification on the basis of intelligence has been increasing since the beginning of the twentieth century.
- Part II presents original research showing significant correlations between intelligence and various social and economic outcomes. For instance, based on data as of 1989 this section shows that among non-Hispanic whites, intelligence level (cognitive class) is a better predictor of poverty than parents' socioeconomic class as shown on the summary table below:
-
-
Percentage in Poverty Category Parents' socioeconomic class Cognitive class Very high/Very bright 3 2 High/Bright 3 3 Average 7 6 Low/Dull 12 16 Very low/Very dull 24 30 Overall average 7 7
-
- Part III, by far the most controversial, examines what role IQ plays in contributing to social and economic differences between ethnic groups in the United States.
- Part IV discusses the implications of the findings for education and social policy in the United States.
Herrnstein and Murray in many ways follow in the footsteps of UC Berkeley researcher Arthur Jensen, whose controversial article on the subject appeared in 1969 in the Harvard Educational Review. The Bell Curve argues that:
- Intelligence exists and is accurately measurable across racial, language, and national boundaries.
- Intelligence is one, if not the most, important correlative factor in economic, social, and overall success in the United States, and is becoming more important.
- Intelligence is largely (40% to 80%) genetically heritable.
- No one has so far been able to manipulate IQ long term to any significant degree through changes in environmental factors - except for child adoption - and in light of their failure such approaches are becoming less promising.
- The USA has been in denial regarding these facts, and in light of these findings a better public understanding of the nature of intelligence and its social correlates is necessary to guide future policy decisions in America.
Their evidence comes from an analysis of data compiled in the National Longitudinal Study of Youth (NLSY), a study conducted by the U.S. Department of Labor's Bureau of Labor Statistics tracking thousands of Americans starting in the 1980s. All participants in the NLSY took the Armed Services Vocational Aptitude Battery (ASVAB), a battery of ten tests taken by all who apply for entry into the armed services. Four of those tests comprise the Armed Forces Qualification Test, a measure of cognitive ability comparable to an IQ test. (Some had taken an IQ test in high school, and the median correlation of the AFQT and those tests was .81.) Participants were later evaluated for social and economic outcomes. In general, IQ/AFQT scores were a better predictor of life outcomes than social class background. Similarly, after statistically controlling for differences in IQ, many outcome differences between racial-ethnic groups disappeared. (See also Significance of group IQ differences.)
| IQ | <75 | 75-90 | 90-110 | 110-125 | >125 |
|---|---|---|---|---|---|
| US population distribution | 5 | 20 | 50 | 20 | 5 |
| Married by age 30 | 72 | 81 | 81 | 72 | 67 |
| Out of labor force more than 1 month out of year (men) | 22 | 19 | 15 | 14 | 10 |
| Unemployed more than 1 month out of year (men) | 12 | 10 | 7 | 7 | 2 |
| Divorced in 5 years | 21 | 22 | 23 | 15 | 9 |
| % of children w/ IQ in bottom decile (mothers) | 39 | 17 | 6 | 7 | - |
| Had an illegitimate baby (mothers) | 32 | 17 | 8 | 4 | 2 |
| Lives in poverty | 30 | 16 | 6 | 3 | 2 |
| Ever incarcerated (men) | 7 | 7 | 3 | 1 | 0 |
| Chronic welfare recipient (mothers) | 31 | 17 | 8 | 2 | 0 |
| High school dropout | 55 | 35 | 6 | 4 | 0 |
| Values are the percentage of each IQ sub-population, among non-Hispanic whites only, fitting each descriptor. Herrnstein & Murray (1994) pp. 171, 158, 163, 174, 230, 180, 132, 194, 247-248, 194, 146 respectively. | |||||
[edit] Policy recommendations
Herrnstein and Murray recommended the elimination of welfare policies that encourage poor women to have babies:
- We can imagine no recommendation for using the government to manipulate fertility that does not have dangers. But this highlights the problem: The United States already has policies that inadvertently social-engineer who has babies, and it is encouraging the wrong women. If the United States did as much to encourage high-IQ women to have babies as it now does to encourage low-IQ women, it would rightly be described as engaging in aggressive manipulation of fertility. The technically precise description of America's fertility policy is that it subsidizes births among poor women, who are also disproportionately at the low end of the intelligence distribution. We urge generally that these policies, represented by the extensive network of cash and services for low-income women who have babies, be ended. (p. 548)
This claim spurred later research in economics and sexology, which considered that welfare programs for females had a doubly negative effect on aggregate IQ within the transfer group, by allowing the female partner to forgo a full consideration of the male's ability to serve as a provider of familial resources, instead placing greater emphasis on desirable physical or social characteristics (presumed to be not as positively correlated with IQ). Neither of these claims, as originally embodied in text and the follow-on research, dealt with race as such, but rather demonstrated concern that large numbers of minorities were positioned as recipients, leading to a continual worsening of the measured divergence in intelligence. However, two years later, the 1996 U.S. welfare reform substantially cut these programs.
In a discussion of the future political outcomes of an intellectually stratified society, they stated that they "fear that a new kind of conservatism is becoming the dominant ideology of the affluent - not in the social tradition of an Edmund Burke or in the economic tradition of an Adam Smith but 'conservatism' along Latin American lines, where to be conservative has often meant doing whatever is necessary to preserve the mansions on the hills from the menace of the slums below" (p. 518). Moreover, they fear that increasing welfare will create a "custodial state" in "a high-tech and more lavish version of the Indian reservation for some substantial minority of the nation's population." They also predict increasing totalitarianism: "It is difficult to imagine the United States preserving its heritage of individualism, equal rights before the law, free people running their own lives, once it is accepted that a significant part of the population must be made permanent wards of the states" (p. 526).
[edit] G factor
Knowledge of the general intelligence factor (g) is important to evaluate the debates on testing. The g factor is an almost universally supported, and very important, construct in psychometry.[2] In a battery of mental ability tests given to a group of people, all the tests are positively correlated with each other; those who are above average in one will, on average, be above average on the others.
Factor analysis can extract a smaller number of factors to account for the variation in the scores; this is possible because the more two tests measure the same thing, the greater their correlations will be. One factor, g can then be extracted (sometimes after another layer of specific factors are removed). The correlation of the test scores with g is its g-loading; a high one is desirable in a test.
g is correlated with a wide range of social outcomes; some are such as income, academic achievement, job performance, and career prestige, poverty, dropping out, and out-of-marriage childbirth. g correlates with both speed and consistency of performance on elementary cognitive tasks (simple ones that can be done by everybody without failure). All of this was mentioned in The Bell Curve, and many biological and neurological correlates have been discovered since, in addition to the long known ones such as brain size. These include the frequency of alpha brain waves, latency and amplitude of evoked brain potentials, rate of brain glucose metabolism, and general health as some of the best established ones. Almost all of a test's predictive validity lies in g, as opposed to the more specific factors. The AFQT and IQ tests are very highly g-loaded.
[edit] Responses
Initially, The Bell Curve received a great deal of positive publicity, including cover stories in Newsweek ("the science behind [it] is overwhelmingly mainstream"), early publication (under protest by other writers and editors) in The New Republic by its editor-in-chief at the time Andrew Sullivan, and The New York Times Book Review (which suggested critics disliked its "appeal to sweet reason" and are "inclined to hang the defendants without a trial"). Early articles and editorials appeared in Time, The New York Times ("makes a strong case"), The New York Times Magazine, Forbes, the Wall Street Journal, and National Review. It received a respectful airing on such shows as Nightline, the MacNeil/Lehrer NewsHour, the McLaughlin Group, Think Tank, PrimeTime Live, and All Things Considered.[3] The book sold over 500,000 copies in hardcover.
While the book's popularity was mostly propelled by its controversial claims regarding race and intelligence, both the accuracy of those claims and the qualifications of the authors soon came under attack in the media. Herrnstein died before the book was released, leaving its public defense to co-author Charles Murray. Although Herrnstein was a psychologist, Murray is a conservative think tank analyst with a Ph.D. in political science and no credentials in psychometrics.
Some scholars have condemned the book. University of Oklahoma Assistant Professor of Anthropology Michael Nunley wrote:
I believe this book is a fraud, that its authors must have known it was a fraud when they were writing it, and that Charles Murray must still know it's a fraud as he goes around defending it. [...] After careful reading, I cannot believe its authors were not acutely aware of [...] how they were distorting the material they did include.
Professor Leon Kamin, a longtime critic of cognitive ability tests, said the book was "a disservice to and abuse of science." Harvard University psychologist Howard Gardner, who teaches in the department of education, called the book's style of thought "scholarly brinkmanship":
The authors seem to show the evidence and leave the implications for the reader to figure out; discussing scientific work on intelligence, they never quite say that intelligence is all important and tied to one's genes, yet they signal that this is their belief and that readers ought to embrace the same conclusions.
Columnist Bob Herbert, writing for The New York Times, described the book as "a scabrous piece of racial pornography masquerading as serious scholarship." "Mr. Murray can protest all he wants," wrote Herbert; "his book is just a genteel way of calling somebody a nigger."[4]
Economist and conservative writer Thomas Sowell criticized the book's conclusions about race and the malleability of IQ, writing:[5]
When European immigrant groups in the United States scored below the national average on mental tests, they scored lowest on the abstract parts of those tests. So did white mountaineer children in the United States tested back in the early 1930s... Strangely, Herrnstein and Murray refer to "folklore" that "Jews and other immigrant groups were thought to be below average in intelligence." It was neither folklore nor anything as subjective as thoughts. It was based on hard data, as hard as any data in The Bell Curve. These groups repeatedly tested below average on the mental tests of the World War I era, both in the army and in civilian life. For Jews, it is clear that later tests showed radically different results — during an era when there was very little intermarriage to change the genetic makeup of American Jews.
In its defense, fifty-two professors, most of them psychologists including researchers in the study of intelligence and related fields, signed an opinion statement titled "Mainstream Science on Intelligence"[2] endorsing the views presented in The Bell Curve. The statement was written by psychologist Linda Gottfredson and published in The Wall Street Journal in 1994 and reprinted in the Intelligence[3]. Only seven of the 100 invitees contacted said the statement did not represent the mainstream view of intelligence. Some of the signers had been cited as sources for Murray and Herrnstein's book.
[edit] American Psychological Association task force report
In response to the growing controversy surrounding The Bell Curve, the American Psychological Association's Board of Scientific Affairs established a special task force to publish an investigative report on the research presented in the book.[4] The final report, titled Intelligence: Knowns and Unknowns, is available at an academic website. [5]
Some of the task force's findings supported or were consistent with statements from The Bell Curve. They agreed that:
- IQ scores have high predictive validity for individual differences in school achievement.
- IQ scores have predictive validity for adult occupational status, even when variables such as education and family background have been statistically controlled.
- Individual differences in intelligence are substantially influenced by both genetics and environment.
- There is little evidence to show that childhood diet influences intelligence except in cases of severe malnutrition.
- There are no statistically significant differences between the IQ scores of males and females.
Regarding Murray and Herrnstein's claims about racial differences and genetics, the APA task force stated:
There is certainly no such support for a genetic interpretation... . It is sometimes suggested that the Black/ White differential in psychometric intelligence is partly due to genetic differences (Jensen, 1972). There is not much direct evidence on this point, but what little there is fails to support the genetic hypothesis.
Regarding statements about other explanations for racial differences, the APA task force stated:
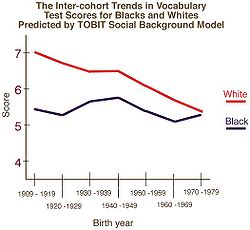
The differential between the mean intelligence test scores of Blacks and Whites (about one standard deviation, although it may be diminishing) does not result from any obvious biases in test construction and administration, nor does it simply reflect differences in socio-economic status. Explanations based on factors of caste and culture may be appropriate, but so far have little direct empirical support.
Regarding statements about any explanations for racial differences, the APA task force stated:
At present, no one knows what causes this differential.
The APA journal that published the statement, American Psychologist, subsequently published eleven critical responses in January 1997.
[edit] Criticisms
It is doubtful whether any book in the entire history of psychology has been so extensively attacked as The Bell Curve.[6] Perhaps the most prominent critic of The Bell Curve was the late Stephen Jay Gould, who in 1996 released a revised and expanded edition of his 1981 controversial book The Mismeasure of Man intended to more directly refute many of The Bell Curve's claims regarding race and intelligence. Specifically, Gould argues that the current evidence showing heritability of IQ does not indicate a genetic origin to group differences in intelligence. Murray claims that Gould misstated his claims; for instance, Gould says Murray boils down intelligence to a single factor while Murray denies making such a claim.
The initial positive reception of The Bell Curve in media such as newspapers and television talk shows was troubling to critics such as economist Edward S. Herman and evolutionary biologist Joseph L. Graves who felt that it indicated an acceptance of what Herman calls "deterministic racist doctrines."[7]
The second wave of reviews, which did not arrive until much later, was composed of expert opinion in the relevant fields. It provided a belated substitute for the peer-review process to which Murray and Herrnstein did not originally submit their work.
Melvin Konner, professor of anthropology and associate professor of psychiatry and neurology at Emory University, called Bell Curve a "deliberate assault on efforts to improve the school performance of African-Americans":
This book presented strong evidence that genes play a role in intelligence but linked it to the unsupported claim that genes explain the small but consistent black-white difference in IQ. The juxtaposition of good argument with a bad one seemed politically motivated, and persuasive refutations soon appeared. Actually, African-Americans have excelled in virtually every enriched environment they have been placed in, most of which they were previously barred from, and this in only the first decade or two of improved but still not equal opportunity. It is likely that the real curves for the two races will one day be superimposable on each other, but this may require decades of change and different environments for different people. Claims about genetic potential are meaningless except in light of this requirement.[8]
[edit] Flawed assumptions
Much of the criticism of The Bell Curve has focused on potential flaws in the basic assumptions made at the beginning of the book. William J. Matthews and Stephen Jay Gould list four basic assumptions of The Bell Curve:
- Intelligence must be reducible to a single number.
- Intelligence must be capable of rank ordering people in a linear order.
- Intelligence must be primarily genetically based.
- Intelligence must be essentially immutable.
According to Gould, if any of these premises are false, then their entire argument disintegrates (Gould, 1994).[9] Similarly, in "Science" in the service of Racism, C. Loring Brace writes that The Bell Curve makes six basic assumptions at the beginning of the book:
- Human Cognitive ability is a single general entity, depictable as a single number.
- Cognitive ability has a heritability of between 40 and 80 percent and is therefore primarily genetically based.
- IQ is essentially immutable, fixed over the course of a life span.
- IQ tests measure how "smart" or "intelligent" people are and are capable of rank ordering people in a linear order.
- IQ tests can measure this accurately.
- IQ tests are not biased with regard to race ethnic group or socioeconomic status.
Brace proceeds to argue that there are faults in every one of these assumptions. The Nobel Prize winning economist James Heckman writes that two assumptions made in the book are questionable:
- "g" [the one-ability model of human intelligence] accounts for correlation across test scores and performance in society.
- "g" cannot be manipulated.
Heckman writes that a reanalysis of the evidence used in The Bell Curve contradicts this story. The factors that explain wages receive different weights than the factors that explain test scores. More than "g" is required to explain either. Other factors besides "g" contribute to social performance, and they can be manipulated.[10] Murray responded to a shorter version of Heckman's critique in an August 1995 letter exchange in Commentary magazine.
[edit] Flawed methodology
Michael Hout of the University of California at Berkeley, along with five colleagues, recalculated the effect of socioeconomic status, using the same variables as The Bell Curve, but weighting them differently. They found that if IQ scores are corrected, as Herrnstein and Murray did, to eliminate the effect of education, the ability of IQ to predict poverty can be made to look dramatically overstated, by as much as 61 percent for whites and 74 percent for blacks. In other words, according to Hout et al., Herrnstein and Murray's finding, that IQ predicts poverty much better than socioeconomic status does, is substantially a result of the way they handled the statistics.[11] In a paper titled A Reanalysis of The Bell Curve, researchers found that Herrnstein and Murray's measure of parental socioeconomic status failed to capture the effects of important elements of family background (such as single-parent family structure at age 14). As a result, their analysis gave an exaggerated impression of the importance of IQ relative to parents` SES, and relative to family background.[12]
In the book Intelligence, Genes, and Success: Scientists Respond to The Bell Curve, a group of social scientists and statisticians analyzes the genetics-intelligence link, the concept of intelligence, the malleability of intelligence and the effects of education, the relationship between cognitive ability, wages and meritocracy, pathways to racial and ethnic inequalities in health, and the question of public policy. This work argues that much of the public response was polemic, and failed to analyze the details of the science and validity of the statistical arguments underlying the book's conclusions.[13]
William J. Matthews writes that part of The Bell Curve's analysis is based on the AFQT "which is not an IQ test but designed to predict performance of certain criterion variables".[14] Nobel Prize in Economics winner James J. Heckman observed that the AFQT was designed only to predict success in military training schools and that most of these tests appear to be achievement tests rather than ability tests, measuring factual knowledge and not pure ability. He continues:
- Ironically, the authors delete from their composite AFQT score a timed test of numerical operations because it is not highly correlated with the other tests. Yet it is well known that in the data they use, this subtest is the single best predictor of earnings of all the AFQT test components. The fact that many of the subtests are only weakly correlated with each other, and that the best predictor of earnings is only weakly correlated with their "g-loaded" score, only heightens doubts that a single-ability model is a satisfactory description of human intelligence. It also drives home the point that the "g-loading" so strongly emphasized by Murray and Herrnstein measures only agreement among tests—not predictive power for socioeconomic outcomes. By the same token, one could also argue that the authors have biased their empirical analysis against the conclusions they obtain by disregarding the test with the greatest predictive power.[15][10]
[edit] Contradictory findings
A recent paper in the Psychological Review, "Heritability Estimates Versus Large Environmental Effects: The IQ Paradox Resolved," presents a mechanism by which environmental effects on IQ may be magnified by feedback effects. This approach may provide a resolution of the contradiction between the viewpoint of The Bell Curve and its supporters, and the 'nurture' factors of IQ believed to exist by its critics. Janet Currie and Duncan Thomas presented evidence suggesting AFQT scores are likely better markers for family background than "intelligence" in a 1999 Study.
Herrnstein and Murray report that conditional on maternal "intelligence" (AFQT scores), child test scores are little affected by variations in socio-economic status. Using the same data, we demonstrate their finding is very fragile.[17]
Charles R. Tittle, Thomas Rotolo found that the more that written, IQ-like examinations are used as screening devices for occupational access, the stronger the relationship between IQ and income. Thus, rather than higher IQ leading to status attainment because it indicates skills needed in a modern society, IQ may reflect the same test-taking abilities used in artificial screening devices by which status groups protect their domains.[18] Min-Hsiung Huang and Robert M. Hauser write that Herrnstein and Murray provide scant evidence of growth in cognitive sorting. Using data from the General Social Survey, they tested each of these hypotheses using a short verbal ability test which was administered to about 12,500 American adults between 1974 and 1994; the results provided no support for any of the trend hypotheses advanced by Herrnstein and Murray. One chart in The Bell Curve purports to show that people with IQs above 120 have become "rapidly more concentrated" in high-IQ occupations since 1940. But Robert Hauser and his colleague Min-Hsiung Huang retested the data and came up with estimates that fell “well below those of Herrnstein and Murray." They add that the data, properly used, "do not tell us anything except that selected, highly educated occupation groups have grown rapidly since 1940."[19]
[edit] Fueling racism
Dennis M. Rutledge suggests that through soundbites of works like Jensen's famous study on the achievement gap, and Herrnstein and Murray's book The Bell Curve, the media "paints a picture of Blacks and other people of color as collective biological illiterates—as not only intellectually unfit but evil and criminal as well," thus providing, he says "the logic and justification for those who would further disenfranchise and exclude racial and ethnic minorities."[20]
Some critics point out that 17 of the researchers whose work is referenced by the book are also contributors to Mankind Quarterly, America's leading eugenics magazine, which reprints articles such as Eugenics And The Jew by Francis Galton. In his book The Bell Curve Wars: Race, Intelligence, and the Future of America, Steven Fraser writes that "by scrutinizing the footnotes and bibliography in The Bell Curve, readers can more easily recognize the project for what it is: a chilly synthesis of the work of disreputable race theorists and eccentric eugenicists".[21]
Since the book promulgated the idea that blacks were on average less intelligent than whites, some people fear that The Bell Curve can be used by extremists to justify genocide and hate crimes.[22][23] Critics have noted much of the work referenced by the Bell Curve was funded by the Pioneer Fund, which aims to advance the scientific study of heredity and human differences, and has been accused of promoting scientific racism.[24][25][26]
[edit] Responses to criticisms
According to Christopher Chabris, at the time a Ph.D. student at Harvard and currently assistant professor at Union College,[27] the most common responses to The Bell Curve involve "phony controversies", adding that "the vast majority of those commenting on The Bell Curve" in books such as The Bell Curve Wars "have little or no scientific authority".[28]
[edit] Author's follow-up
| IQ | <75 | 75–90 | 90–110 | 110–125 | >125 |
|---|---|---|---|---|---|
| Age 18 | 2,000 | 5,000 | 8,000 | 8,000 | 3,000 |
| Age 26 | 3,000 | 10,000 | 16,000 | 20,000 | 21,000 |
| Age 32 | 5,000 | 12,400 | 20,000 | 27,000 | 36,000 |
| Values are the average earnings (1993 US Dollars) of each IQ sub-population.[29] | |||||
Murray responded to specific criticisms of the analysis of the practical importance of IQ compared to socio-economic status (Part II of The Bell Curve) in a 1998 book Income Inequality and IQ[30] To circumvent criticisms surrounding their use of a statistical control for socioeconomic status (SES), Murray adopted a sibling design. Rather than statistically controlling for parental SES, Murray compared life outcome differences among full sibling pairs who met a number of criteria in which one member of the pair has an IQ in the "normal" range and the other siblings has an IQ in a higher or lower IQ category. According to Murray, this design controls for all aspects of family background (full siblings share the same family background, growing up together in the same home and the same community).
| Indicator | Bell Curve control for parental SES | Sibling fixed-effect model |
|---|---|---|
| Annual earnings, year-round workers | 5548 | 5317 |
| Years of schooling | 0.59 | 0.45 |
| Attainment of BA | 1.76 | 1.87 |
| High-IQ occupation | 1.39 | 1.72 |
| Out of labor force 1+ month | -0.34 | -0.3 |
| Unemployed 1+ month | -0.52 | -0.47 |
| IQ | <75 | 75–90 | 90–110 | 110–125 | >125 |
|---|---|---|---|---|---|
| Mean years of education | 11.4 (10.9) | 12.3 (11.9) | 13.4 (13.2) | 15.2 (15.0) | 16.5 (16.5) |
| Percentage obtaining B.A. | 1 (1) | 4 (3) | 19 (16) | 57 (50) | 80 (77) |
| Mean weeks worked | 35.8 (30.7) | 39.0 (36.5) | 43.0 (41.8) | 45.1 (45.2) | 45.6 (45.4) |
| Mean earned income | 11,000 (7,500) | 16,000 (13,000) | 23,000 (21,000) | 27,000 (27,000) | 38,000 (36,000) |
| Percentage with a spouse who has earned income | 30 (27) | 38 (39) | 53 (54) | 61 (59) | 58 (58) |
| Mean earned family income | 17,000 (12,000) | 25,000 (23,400) | 37,750 (37,000) | 47,200 (45,000) | 53,700 (53,000) |
| Percentage children born out of wedlock | 49 (50) | 33 (32) | 14 (14) | 6 (6) | 3 (5) |
| Fertility to date | 2.1 (2.3) | 1.7 (1.9) | 1.4 (1.6) | 1.3 (1.4) | 1.0 (1.0) |
| Mother's mean age at birth | 24.4 (22.8) | 24.5 (23.7) | 26.0 (25.2) | 27.4 (27.1) | 29.0 (28.5) |
| Values are "Utopian sample" ("Full sample"). Earning values are the 1993 US Dollars.[30] | |||||
[edit] Notes
- ^ "Behind the Curve" by Leon J. Kamin in Race & IQ edited by Ashley Montagu (1999) pp.397-407.
- ^ [1] The g factor: the science of mental ability, A.R. Jensen
- ^ Racism Resurgent:How Media Let The Bell Curve's Pseudo-Science Define the Agenda on Race By Jim Naureckas January/February 1995
- ^ Herbert, Bob (1994-10-26). "In America; Throwing a Curve" (HTML). The New York Times. http://query.nytimes.com/gst/fullpage.html?res=9F01E5DE123FF935A15753C1A962958260. Retrieved on 2007-01-09.
- ^ Sowell, Thomas (1995). "Ethnicity and IQ". The American Spectator 28 (2). http://search.opinionarchives.com/Summary/AmericanSpectator/V28I2P32-1.htm.
- ^ The Attack on The Bell Curve By Richard Lynn Personality and Individual Differences 26, (1999), pp. 761-765
- ^ Fog Watch: The New Racist Onslaught
- ^ The Tangled Wing Biological Constraints on the Human Spirit by Melvin Konner, 2nd edition, p. 428
- ^ A Review of the Bell Curve: Bad Science Makes for Bad Conclusions
- ^ a b Lessons from the Bell Curve James J. Heckman The Journal of Political Economy, Vol. 103, No. 5 (Oct., 1995), pp. 1091-1120
- ^ Inequality by Design:Cracking the Bell Curve Myth Claude S. Fischer, Michael Hout, Martín Sánchez Jankowski, Samuel R. Lucas, Ann Swidler, and Kim Vos
- ^ A Reanalysis of The Bell Curve Korenman, Sanders and Winship, Christopher, (August 1995). NBER Working Paper Series, Vol. w5230, pp. -, 1995
- ^ Intelligence, Genes, and Success: Scientists Respond to "the Bell Curve" Bernie Devlin, Richard J. Herrnstein ISBN 0387949860
- ^ William J. Matthews, Ph.D. (1998) A Review of the Bell Curve: Bad Science Makes for Bad Conclusions
- ^ Cracked Bell James J. Heckman. March 1995. Reason
- ^ Convergent Trends in Black-White Test-Score Differentials in the U.S.: A Correction of Richard Lynn Min-Hsiung Huang and Robert M. Hauser 2000
- ^ The Intergenerational Transmission of 'Intelligence' Down the Slippery Slopes of 'The Bell Curve' Industrial Relations: A Journal of Economy and Society, Vol. 38, No. 3, July 1999
- ^ IQ and Stratification: An Empirical Evaluation of Herrnstein and Murray's Social Change Argument Charles R. Tittle, Thomas Rotolo Social Forces, Vol. 79, No. 1 (Sep., 2000), pp. 1-28
- ^ Verbal Ability and Socioeconomic Success: A Trend Analysis Hauser R.M.; Huang M.H.
- ^ Social Darwinism, scientific racism, and the metaphysics of race Journal of Negro Education, The, Summer 1995 by Dennis, Rutledge M
- ^ The Bell Curve Wars: Race, Intelligence, and the Future of America Book by Steven Fraser; Basic Books, 1995
- ^ Ann Coulter and Charles Darwin. Coultergeist by Jerry Coyne
- ^ The Bell Curve: An illustration of the existence of social science as a social problem
- ^ Racism Resurgent
- ^ ABC World News Tonight. November 22, 1994
- ^ slate.com, The Bell Curve Revisited, Stephen Metcalf, October 17, 2005.
- ^ "Union College Dept. of Psychology Faculty". http://www.union.edu/Academics/Departments/deptView.php?code=PY. Retrieved on 2009-03-09.
- ^ IQ Since "The Bell Curve"
- ^ Murray, C. (1997). IQ and economic success. Public Interest, 128, 21–35.
- ^ a b Murray, C. (1998). Income Inequality and IQ. Washington: AEI Press.
[edit] References
- Montagu, Ashley, editor. Race and IQ. Oxford University Press, 1999.
- Russell Jacoby and Naomi Glauberman, editors, The Bell Curve Debate: History, Documents, Opinions, Random House/Times Books (1995) 81 articles by 81 academics and journalists from the full spectrum of political views on title topic.Excerpts from The Bell Curve Debate
- Claude S. Fischer et al. Inequality by Design: Cracking the Bell Curve Myth Princeton University Press, 1996, ISBN 0-691-02898-2.
- Bernie Devlin et al. Intelligence, Genes, and Success: Scientists Respond to The Bell Curve. Copernicus Books, 1997, ISBN 0-387-94986-0.
- Weiss, V. (1995). The emergence of a cognitive elite. Comment on 'The Bell Curve' by Herrnstein and Murray. Mankind Quarterly 35, 373-390.
[edit] External links
- "The Inequality Taboo", Commentary Magazine. By political scientist Charles Murray.
- Interview with Charles Murray
- Booknotes interview with Murray on The Bell Curve, December 4, 1994.
[edit] Responses to and critiques of The Bell Curve
- James Heckman's critique of Murray and Herrnstein's statistical techniques
- American Psychological Association 1996 statement on issues raised by The Bell Curve
- "Intelligence: Knowns and Unknowns" Full text of American Psychological Association report in response to The Bell Curve
- "The Heritability of IQ"; Nature, 1997 July 31;388(6641):468-71
- "Heritability Estimates Versus Large Environmental Effects: The IQ Paradox Resolved"; Psychological Review, 2001, Vol. 108, No. 2, 346?369
- Opinion piece called "Mainstream Science on Intelligence" The Wall Street Journal, December 13, 1994, p. A18]
- "Revisiting the Bell Curve" An article by Alan Reifman, which reviews pertinent research on the genetic contribution to intelligence, the relative contributions of intelligence and social factors to success in life, and the potential of educational experience to improve cognitive ability.
- "Flattening The Bell Curve" by Nicholas Lemann in Slate Magazine, January 18, 1997
- Fairness and Accuracy in Reporting, Racism Resurgent: How Media Let The Bell Curve's Pseudo-Science Define the Agenda on Race
- Critical analysis of Bell Curve statistical methodology
- The Return of Determinism? The Pseudoscience of the Bell Curve
- Nobel Prize-winner James Heckman, "Lessons from the Bell Curve", Journal of Political Economy, October 1995.
- The Bell Curve Wars: Intelligence and the Future of America", Steven Frazer, editor

