FIFA World Rankings
From Wikipedia, the free encyclopedia
| Top 25 Rankings as of March 2009[1] | |||
|---|---|---|---|
| Rank | Team | Points | Confederation |
| 1 | 1666 | UEFA | |
| 2 | 1366 | UEFA | |
| 3 | 1317 | UEFA | |
| 4 | 1284 | UEFA | |
| 5 | 1260 | CONMEBOL | |
| 6 | 1219 | CONMEBOL | |
| 7 | 1169 | UEFA | |
| 8 | 1128 | UEFA | |
| 9 | 1083 | UEFA | |
| 10 | 1025 | UEFA | |
| 11 | 1009 | UEFA | |
| 12 | 1004 | UEFA | |
| 13 | 998 | UEFA | |
| 14 | 927 | UEFA | |
| 15 | 908 | CONMEBOL | |
| 16 | 900 | CAF | |
| 17 | 896 | CONCACAF | |
| 18 | 888 | UEFA | |
| 19 | 863 | UEFA | |
| 20 | 849 | UEFA | |
| 21 | 836 | CONMEBOL | |
| 22 | 831 | UEFA | |
| 23 | 784 | CONCACAF | |
| 24 | 783 | CAF | |
| 25 | 782 | UEFA | |
The FIFA World Rankings is a ranking system for men's national teams in Association football, currently led by Spain. The teams of the member nations of FIFA (Fédération Internationale de Football Association), football's world governing body, are ranked based on their game results with the most successful teams being ranked highest. A point system is used, with points being awarded based on the results of FIFA-recognized international matches. Under the existing system, rankings are based on a team's performance over the last four years, with more recent results and more significant matches being more heavily weighted to help reflect the current competitive state of a team. The ranking system was most recently revamped after the 2006 World Cup, with the first edition of the new series of rankings issued on July 12, 2006. The most significant change is that the rankings are now based on results over the previous four years instead of the previous eight years. The change is perceived to respond to criticisms that the rankings do not effectively reflect the relative strengths of the national teams. (See section Criticism).
Alternative systems have been devised, such as the World Football Elo Ratings, based on the Elo rating system used in chess, ranking teams on an all time basis. The UFWC (Unofficial Football World Championships) ranks teams on the number of times they have defended the Unofficial Football World Championship, an award devised solely for that purpose.
Contents |
[edit] History

In December 1992, FIFA first published a listing in rank order of its member associations provide a basis for comparison of the relative strengths of these teams. From the following August, with sponsorship from Coca-Cola, this list was more frequently updated, to be published most months.[2] Significant changes were implemented in 1999 and again in 2006, as a reaction to criticisms of the system.[3] Membership of FIFA has expanded from 167 to 208 since the rankings began, but one member, São Tomé and Príncipe, is not included in the rankings as they have not played a recognised international fixture for more than 4 years.
[edit] 1999 update
When the rankings were initially introduced, a team received one point for a draw or three for a victory in FIFA-recognized matches - much the same as a traditional league scoring system. This was a quite simplistic approach, however, and FIFA quickly realised that there were many factors affecting international matches. In order to meet the objective of fairly and accurately comparing the relative strengths of various national sides, the system was updated. The major changes were as follows:
- the point ranking was scaled up by a factor of ten
- the method of calculation was changed to take into account factors including:
- the number of goals scored or conceded
- whether the match was played at home or away
- the importance of a match or competition
- regional strength
- a fixed number of points were no longer necessarily awarded for a victory or a draw
- match losers were able to earn points
Two new awards were introduced as part of the system:
The changes made the ranking system more complex, but helped improve its accuracy by making it more comprehensive.
[edit] 2006 ranking system update
FIFA announced that the ranking system would be updated following the 2006 World Cup. The evaluation period was cut from eight to four years, and a simpler method of calculation is now used to determine rankings.[4] Goals scored and home or away advantage are no longer taken into account, and other aspects of the calculations, including the importance attributed to different types of match, have been revised. The first set of revised rankings and the calculation methodology were announced on 12 July 2006.
This change is rooted at least in part in widespread criticism of the previous ranking system. Many football enthusiasts felt it was inaccurate, especially when compared to other ranking systems and that it was not sufficiently responsive to changes in the performance of individual teams. The recent and unexpectedly high rankings of teams from the Czech Republic and the United States were generally met with scepticism and negatively affected the credibility of the system in the eyes of many followers of the sport. The poor showings and early exit of these two sides from the 2006 World Cup competition appear to lend some credence to the criticism.
[edit] Rank leaders
When the system was introduced, Germany debuted as the top ranked team following their extended period of dominance in which they had reached the three previous FIFA World Cup finals, winning one of them. Brazil took the lead in the run up to the 1994 FIFA World Cup after winning eight and losing only one of nine qualification matches, while on the way scoring twenty goals and conceding just four. Italy then led for a short time on the back of their own equally successful World Cup qualifying campaign, after which the top place was re-claimed by Germany.
Brazil's success in their lengthy qualifying campaign returned them to the lead for a brief period. Germany led again during the 1994 World Cup, until Brazil’s victory in that competition gave them a large lead that would stand up for nearly seven years, until they were surpassed by a strong France team that captured both the 1998 FIFA World Cup and the 2000 European Football Championship. Success at the 2002 FIFA World Cup restored Brazil to the top position, where they remained until February 2007, when Italy returned to the top for the first time since 1993 following their 2006 FIFA World Cup win in Germany. Just one month later, Argentina replaced them, reaching the top for the first time, but Italy regained its place in April. After winning the Copa America 2007 in July, Brazil returned to the top, but were replaced by Argentina in October. In July 2008, Spain took over the lead for the first time, having won UEFA Euro 2008.
[edit] Uses of the rankings
The rankings are used by FIFA to rank the progression and current ability of the national football teams of its member nations, and claims that they create "a reliable measure for comparing national A-teams".[2] They are used as part of the calculation, or the entire grounds to seed competitions. In the 2010 FIFA World Cup qualification tournament, the rankings were used to seed the groups in the competitions involving CONCACAF members (using the May rankings), CAF (with the July set of data), and UEFA, using the specially postponed November 2007 ranking positions.
The rankings are also used to determine the winners of the two annual awards national teams receive on the basis of their performance in the rankings.
[edit] Criticism
Since their introduction in 1993, the FIFA World Rankings have been the matter of much debate, particularly regarding the calculation procedure and the resulting disparity between generally perceived quality and world ranking of some teams. For example Norway was ranked second in October 1993 and July-August 1995,[5] and the United States reached fourth in 2006, to the surprise of even their own players.[6] However, criticism regarding the unrealistic ranking continued even after the introduction of the new formula, with Israel's climb to 15th in November 2008 raising a few eyebrows even in the Israeli press,[7][8][9] with Israel missing a huge opportunity to break in the top 10[10] after conceding a last gasp equalizer against Latvia.
One of the main criticisms[11] prior to July 2006 was that the rankings considered the performances of teams over an eight year period, and that teams' ranking positions did not correlate to their recent performances.[5] This criticism has lessened somewhat with the introduction of a new formula, reflecting results over a four year period, introduced in July 2006.
Another criticism is that a countries points are the average of all matches played over the past four years (with decreasing contribution), resulting in situations where winning a game reduces a countries ranking. For example if England wins against Spain (ranked 1st), in a friendly they will gain (3 x 1 x 2 x 1 x 100) = 600 points for the match. If the average of their previous matches is 1083 before playing Spain (i.e. England has 1083 pts in the FIFA world ranking system), after playing Spain there will be an additional game with 600 pts contributing to the average, resulting in a new average of less than 1083.
The perceived flaws in the FIFA system have led to the creation of a number of alternative rankings from football statisticians[5] including the World Football Elo Ratings and the rec.sport.soccer Statistics Foundation rankings.
[edit] Current calculation method
After the 2006 FIFA World Cup, a revised calculation procedure for the FIFA rankings was introduced; it is a significantly simplified procedure. The new rankings were compiled in response to criticism from the media.[2] Meetings were attended by FIFA staff and external experts and a large amount of research was conducted by this group, resulting in the new ranking system.[2] The new system was confirmed in Leipzig on 7 December 2005 by a committee of FIFA executives. Notable changes include the dropping of the home or away advantage and number of goals from the calculation, and the simplification of many aspects of the system.
The system, like the previous ones, is extremely similar to that of a league, though with changes made to ensure that it is still representative of the teams' performance despite playing differing numbers of matches per annum, and the differing strength of opposition that teams have to face. The factors taken into account are as follows:
- Match result
- Match status
- Opposition strength
- Regional strength
Teams' actual scores are a result of the average points gained over each calendar year; matches from the previous four years are considered, with more weight being given to recent ones. Teams must have played at least 5 matches within the last twelve months to gain ranking points.
[edit] Win, draw or defeat
In previous years a complicated system of points allocation was used, depending on how strong the opponent was, and how large the loss margin, which allowed weaker losing teams to gain points when playing a much stronger opposition, if they managed to put up a decent match. With the new system, the points allocation is simpler: three points for a win, one point for a draw, and zero points for a loss, in line with most league systems around the world.
In the event of a match being decided by a penalty shootout, the winning team receives two points, and the losing team one point.
| Result | Points |
|---|---|
| Win (no penalty shootout) | 3 |
| Win (penalty shootout) | 2 |
| Draw | 1 |
| Loss (penalty shootout) | 1 |
| Loss (no penalty shootout) | 0 |
[edit] Match status
Different matches have different importance to teams, and FIFA has tried to respect this by using a weighting system, where the most significant matches are in the World Cup finals,[12] and the lowest weighted are friendly matches. FIFA states that it wishes to recognise that friendlies are still important, since they make up half of the competitive matches counted in the rankings.[13] FIFA also stated, however, that it did not plan to make any adjustment for teams that qualify directly for major tournaments.[14][15]
The match status multipliers are as follows:
| Match status | Multiplier |
|---|---|
| Friendly match | x 1.0 |
| FIFA World Cup and Continental cup qualifiers | x 2.5 |
| Continental cup and Confederations Cup finals | x 3.0 |
| World Cup finals match | x 4.0 |
[edit] Opponent strength
Obviously, a win against a very highly ranked opponent is a considerably greater achievement than a win against a low-rated opponent, so the strength of the opposing team is a factor.
The new system uses an opposition strength factor based on team rankings. The previous system was based on points difference.
The formula used is:

with the exceptions that the team ranked #1 is given a multiplier of 2.00, and teams ranked 150th and below are assigned the minimum multiplier of 0.50.
- Example 1: the opposition team is currently ranked 8th in the world:
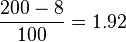
- so the opposition strength multiplier is 1.92
- Example 2: the opposition team is currently ranked 125th in the world:

- so the opposition strength multiplier is 0.75
- Example 3: the opposition team is currently ranked 188th in the world:
Below 150th, so the opposition strength multiplier is the minimum 0.50
The ranking position is taken from the opposition's ranking in the most recently published FIFA World Ranking before the match is included in the ranking calculation.[16]
The rankings published before July 2006 are purely historical and are not used for the new ranking calculation. Instead, FIFA went back as far as 1996 to apply the new formula and is using those new rankings for the current calculations.[17]
See the detailed break-down of point totals for teams from the top 20 in the October 2007 rankings.[18]
[edit] Regional strength
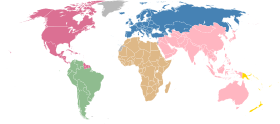
In addition to the opposition strength multiplier, FIFA considers the relative strength of entire confederations in the calculation. Each confederation is assigned a weighting between 0.85 and 1.0, based on the relative performance of the confederations in the last three World Cups. Their values are as follows:[19]
| Confederation | After 2006 World Cup | Up to and including 2006 World Cup |
|---|---|---|
| UEFA (Europe) | 1.00 | 1.00 |
| CONMEBOL (South America) | 0.98 | 0.99 |
| CONCACAF (North and Central America and Caribbean) | 0.85 | 0.88 |
| AFC (Asia) | 0.85 | 0.85 |
| CAF (Africa) | 0.85 | 0.85 |
| OFC (Oceania) | 0.85 | 0.85 |
The multiplier used in the calculation is the average of the regional strength weighting of the two teams:

[edit] Assessment period
Matches played over the last four years (48 months) are included in the calculation, but there is a weighting to put more emphasis on recent results. Previously an eight year period was used. The date weighting is as follows:
| Date of match | Multiplier |
|---|---|
| Within the last 12 months | x 1.0 |
| 12-24 months ago | x 0.5 |
| 24-36 months ago | x 0.3 |
| 36-48 months ago | x 0.2 |
São Tomé and Príncipe were eliminated from the rankings list in December 2007 having exceeded four years without playing a match.
[edit] Ranking formula
The final ranking points figure for a single match is multiplied by 100 and rounded to the nearest whole number.

Results for all matches played in the year are averaged together (assuming at least five matches have been played). The average ranking points for the four previous years, weighted by their multiplier mentioned above, are added together to arrive at the final ranking points.
[edit] Examples
The following examples use these hypothetical teams and confederations, and assume the games are played within the last 12 months:
- Amplistan is currently ranked 2nd in the world and is a member of confederation XYZ (weighting 1.0);
- Bestrudia is currently ranked 188th in the world and is a member of confederation ABC (weighting 0.88);
- Conesto is currently ranked 39th in the world and is a member of confederation QRS (weighting 0.98);
- Delphiz is currently ranked 30th in the world and is a member of confederation HIJ (weighting 0.94).
A friendly match is played between Amplistan and Bestrudia. Amplistan wins 2-1.
| Match | Team | Result points | Match status | Opposition strength | Regional strength | Ranking points |
|---|---|---|---|---|---|---|
| Amplistan vs. Bestrudia (friendly) Result: 2-1 |
Amplistan Bestrudia |
3 0 |
1.0 1.0 |
0.50 1.98 |
0.94 0.94 |
141 0 |
Bestrudia gets no ranking points because it lost the game, so all factors are multiplied by zero.
Amplistan's 141 ranking points are calculated like this:
- 3 points for the win;
- multiplied by 1.0 for match status (friendly match);
- multiplied by 0.50 for opposition strength (Bestrudia is ranked 188th, so it has the minimum 0.50 weighting);
- multiplied by 0.94 for regional strength (the average of the weightings for the two teams' confederations);
- multiplied by 100.
More examples:
| Match | Team | Result points | Match status | Opposition strength | Regional strength | Ranking points |
|---|---|---|---|---|---|---|
| Amplistan vs. Bestrudia (friendly) Result: 1-2 |
Amplistan Bestrudia |
0 3 |
1.0 1.0 |
0.50 1.98 |
0.94 0.94 |
0 558 |
| Amplistan vs. Bestrudia (friendly) Result: 1-1 |
Amplistan Bestrudia |
1 1 |
1.0 1.0 |
0.50 1.98 |
0.94 0.94 |
47 186 |
| Amplistan vs. Bestrudia (World Cup finals) Result: 2-1 |
Amplistan Bestrudia |
3 0 |
4.0 4.0 |
0.50 1.98 |
0.94 0.94 |
564 0 |
| Amplistan vs. Bestrudia (World Cup finals) Result: 1-1 (Bestrudia wins on penalties) |
Amplistan Bestrudia |
1 2 |
4.0 4.0 |
0.50 1.98 |
0.94 0.94 |
188 1488 |
| Amplistan vs. Conesto (friendly) Result: 1-2 |
Amplistan Conesto |
0 3 |
1.0 1.0 |
1.61 1.98 |
0.99 0.99 |
0 588 |
| Conesto vs. Delphiz (Continental cup qualifiers) Result: 4-0 |
Conesto Delphiz |
3 0 |
2.5 2.5 |
1.70 1.61 |
0.96 0.96 |
1224 0 |
| Conesto vs. Delphiz (Continental cup qualifiers) Result: 0-1 |
Conesto Delphiz |
0 3 |
2.5 2.5 |
1.70 1.61 |
0.96 0.96 |
0 1159 |
| Conesto vs. Amplistan (World Cup finals) Result: 0-0 (Amplistan wins on penalties) |
Conesto Amplistan |
1 2 |
4.0 4.0 |
1.98 1.61 |
0.99 0.99 |
784 1275 |
Conesto gets more points than Bestrudia for defeating the same team (Amplistan) because of the higher weighting of its confederation.
[edit] 1999-2006 calculation method
In 1999 FIFA introduced a revised system of ranking calculation, incorporating many changes in response to criticism of inappropriate rankings. For the ranking all matches, their scores and importance were all recorded, and were used in the calculation procedure. Only matches for the senior men's national team were included. Separate ranking systems were used for other representative national sides such as women's and junior teams, for example the FIFA Women's World Rankings. The women's rankings were, and still are, based on a procedure which is a simplified version of the Football Elo Ratings.[20]
[edit] 1993-1999 calculation method
The ranking formula used from 1993-1999 was very simplistic and quickly became noticed for its lack of supporting factors. Teams received 3 points for a win and 1 point for a draw.
[edit] Awards
Each year FIFA hands out two awards to its member nations, based on their performance in the rankings. They are;
[edit] Team of the Year
Team of the Year is awarded to the team whose best seven matches of the year received the greatest number of points overall. The table below shows the 3 best teams of each year.[21]
| Year | First place | Second place | Third place |
|---|---|---|---|
| 2008 | |||
| 2007 | |||
| 2006 | |||
| 2005 | |||
| 2004 | |||
| 2003 | |||
| 2002 | |||
| 2001 | |||
| 2000 | |||
| 1999 | |||
| 1998 | |||
| 1997 | |||
| 1996 | |||
| 1995 | |||
| 1994 | |||
| 1993 |
[edit] Best Mover of the Year
The Best Mover of the Year was awarded to the team who made the best progress up the rankings over the course of the year. In the FIFA rankings, this is not simply the team that has risen the most places, but a calculation is performed in order to account for the fact that it becomes progressively harder to earn more points the higher up the rankings a team is.[2] The calculation used is the number of points the team has at the end of the year (z) multiplied by the number of points it earned during the year (y). The team with the highest index on this calculation received the award. The table below shows the top 3 best movers from each year.[22]
The award has not been an official part of the awards since 2006.
| Year | First place | Second place | Third place |
|---|---|---|---|
| 2006 | |||
| 2005 | |||
| 2004 | |||
| 2003 | |||
| 2002 | |||
| 2001 | |||
| 2000 | |||
| 1999 | |||
| 1998 | |||
| 1997 | |||
| 1996 | |||
| 1995 | |||
| 1994 | |||
| 1993 |
While an official award has not been made for movements since 2006, FIFA has released a list of the 'Best Movers' in the rankings since 2007[23]. However, the calculation methodology had changed to the difference in ranking points over the course of the year (rather than the methodology used in the official award from 1993 to 2006). The results for latter years are based on a similar methodology.
| Year | Best mover | Second best | Third best |
|---|---|---|---|
| 2008 | |||
| 2007 |
[edit] Ranking schedule
Rankings are published monthly, usually on a Wednesday. The deadline for the matches to be considered is the Thursday prior to the release date. [24]
| Rankings Schedule 2009 |
|
| Month | Release Date |
|---|---|
| April | 8 |
| May | 6 |
| June | 3 |
| July | 1 |
| August | 5 |
| September | 2 |
| October | 7 |
| November | 11 |
| December | 16 |
[edit] See also
- FIFA Women's World Rankings
- World Football Elo Ratings
- AQB Sports Ratings
- Aggregated Football World Ranking-List
- Seeding for 2006 FIFA World Cup
[edit] References
- ^ FIFA current ranking
- ^ a b c d e "FIFA/Coca-Cola World Ranking Procedure". FIFA.com. http://www.fifa.com/worldfootball/ranking/procedure/men.html. Retrieved on 2008-03-28.
- ^ "Revised FIFA/Coca-Cola World Ranking". FIFA.com. 2006-07-06. http://www.fifa.com/worldfootball/releases/newsid=104405.html. Retrieved on 2008-03-28.
- ^ "Great expectations". FIFA.com. 2006-05-17. http://www.fifa.com/worldfootball/ranking/news/newsid=104272.html. Retrieved on 2008-03-28.
- ^ a b c "The world rankings riddle". BBC Sport. 2000-12-21. http://news.bbc.co.uk/sport1/hi/football/1081551.stm.
- ^ "FIFA adapting new world rankings". Associated Press. 2006-06-02. http://www.theglobeandmail.com/servlet/story/RTGAM.20060525.wfifa25/BNStory/Sports/home.
- ^ "FIFA chief praises IFA's work". The Jerusalem Post. 2008-08-29. http://www.jpost.com/servlet/Satellite?cid=1225199592139&pagename=JPost%2FJPArticle%2FShowFull. Retrieved on 2009-02-13. "Blatter was also asked about Israel's unrealistic FIFA ranking.Despite failing to qualify for a major tournament in 38 years, the national team is currently ranked number 16 in the world, ahead of such team as Greece, Sweden and Denmark, and just two places below England."
- ^ "Soccer: Quirky FIFA rankings system sees Israel climb to #15". The Jerusalem Post. 2008-11-13. http://www.jpost.com/servlet/Satellite?cid=1226404717350&pagename=JPost%2FJPArticle%2FShowFull. Retrieved on 2009-02-13. "Israel continued its baffling rise up the FIFA rankings on Wednesday, climbing one more position to a best-ever 15th in the world. Amazingly, the national team, which hasn't reached a major tournament since the 1970 World Cup, is ahead of such teams as Greece (18), Nigeria (22), Sweden (29), Scotland (33), Denmark (34) and the Republic of Ireland (36)."
- ^ "The Last Word: It's time to get rid of the FIFA rankings". The Jerusalem Post. 2008-11-14. http://www.jpost.com/servlet/Satellite?cid=1226404731036&pagename=JPost%2FJPArticle%2FShowFull. Retrieved on 2009-02-13. "So the news this week that Israel has risen another place to number 15 in the latest FIFA rankings, above Mexico (25), Nigeria (22), the US (24) and Colombia (40), only serves to underline the futility of the ranking system."
- ^ "FIFA Ranking: November 2008 preview (II)". Football-Rankings.info. 2008-10-20. http://www.football-rankings.info/2008/10/fifa-ranking-november-2008-preview-ii.html. Retrieved on 2009-02-13. "Israel will improve (again!) their best ever ranking, climbing one place to 15th. With a win (instead of a draw) against Latvia they would have been tied for 8th place with Russia."
- ^ "FIFA Rankings". Travour.com. 2006-06-01. http://www.travour.com/fifa-world-cup-2006/fifa-rankings.html.
- ^ Finals is used in this sense to mean the 'final tournament' (as opposed to the qualifying tournament)
- ^ "FIFA/Coca-Cola World Ranking: In focus" (PDF). FIFA.com. 2006-07-07. http://www.fifa.com/mm/document/fifafacts/rawrank/ip590_04e_wrlong_2640.pdf. Retrieved on 2007-06-21.
- ^ "2006 revision of the FIFA/Coca-Cola World Ranking: Frequently Asked Questions About the FIFA World Ranking" (PDF). FIFA. http://www.fifa.com/mm/document/fifafacts/rawrank/ip590_05e_q&a_2641.pdf. Retrieved on 2007-06-21.
- ^ However, 2010 FIFA World Cup hosts South Africa competed in CAF qualifying despite automatically qualifying for the World Cup; this is because CAF chose to combine the 2010 World Cup qualifying tournament with the qualifiers for the 2010 African Cup of Nations, an event for which South Africa had to separately qualify. South Africa failed to qualify for the 2010 African Cup of Nations.
- ^ FIFA Rankings: September 2008 errors (II)
- ^ FIFA miscalculated the rankings... or did they?
- ^ Calculation FIFA Coca-Cola world ranking October 2007
- ^ How are points calculated in the FIFA World Ranking?
- ^ "Women's World Ranking Procedure". FIFA.com. http://www.fifa.com/worldfootball/ranking/procedure/women.html. Retrieved on 2008-03-28.
- ^ Team of the Year Award on the FIFA website
- ^ Best Mover of the Year on the FIFA website
- ^ Top Team and the Best Mover of the Year on the FIFA website (PDF)
- ^ FIFA/Coca-Cola World Ranking Publication Schedule on the FIFA website
[edit] External links
- FIFA.com rankings and statistics, current ranking (to see the lower ranked national football teams, choose the pages 2 till 5)
- FIFA rankings: A Guide to the very first '93 revision (RSSSF)
- How the FIFA men's rankings are calculated
|
|||||||||||||||||||||||||||||