Cepstrum
From Wikipedia, the free encyclopedia
A cepstrum (pronounced /ˈkɛpstrəm/) is the result of taking the Fourier transform (FT) of the decibel spectrum as if it were a signal.[citation needed] Its name was derived by reversing the first four letters of "spectrum". There is a complex cepstrum, a real cepstrum, a power cepstrum, and phase cepstrum.
There are many ways to calculate the cepstrum. Some of them need a phase-wrapping algorithm; others do not.
Operations on cepstra are labelled quefrency analysis, quefrency alanysis, liftering, or cepstral analysis.
Contents |
[edit] Origin and definition
The power cepstrum was defined in a 1963 paper by Bogert et al.[1] It may be defined
- verbally: the power cepstrum (of a signal) is the square of the Fourier transform of the logarithm of the squared magnitude of the Fourier transform of a signal[2]
- mathematically: power cepstrum of signal
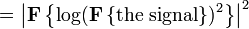
- algorithmically: signal → FT → abs() → square → log → FT → abs() → square → power cepstrum
The complex cepstrum was defined by Oppenheim in his development of homomorphic system theory.[3] It may be defined
- verbally: the complex cepstrum (of a signal) is the Fourier transform of the logarithm (with unwrapped phase) of the Fourier transform (of a signal). Sometimes called the spectrum of a spectrum.
- mathematically: complex cepstrum of signal = FT(log(|FT(the signal)|)+j2πm) (where m is the integer required to properly unwrap the angle or imaginary part of the complex log function)
- algorithmically: signal → FT → abs() → log → phase unwrapping → FT → cepstrum
The real cepstrum uses the logarithm function defined for real values. The real cepstrum is related to the power via the relationship (4 * real cepstrum)^2 = power cepstrum, and is related to the complex cepstrum as real cepstrum = 0.5*(complex cepstrum + time reversal of complex cepstrum).
The complex cepstrum uses the complex logarithm function defined for complex values. The phase cepstrum is related to the complex cepstrum as phase spectrum = (complex cepstrum - time reversal of complex cepstrum).^2
The complex cepstrum holds information about magnitude and phase of the initial spectrum, allowing the reconstruction of the signal. The real cepstrum uses only the information of the magnitude of the spectrum.
Many texts state that the process is FT → abs() → log → IFT, i.e., that the cepstrum is the "inverse Fourier transform of the log of the spectrum". [4] This is not the definition given in the original paper, but it is widespread.[citation needed] Note that the Fourier inversion theorem inherently relates the two processes.[dubious ]
[edit] Applications
The cepstrum can be seen as information about rate of change in the different spectrum bands. It was originally invented for characterizing the seismic echoes resulting from earthquakes and bomb explosions. It has also been used to analyze radar signal returns.
The autocepstrum is defined as the cepstrum of the autocorrelation. The autocepstrum is more accurate than the cepstrum in the analysis of data with echoes.
The cepstrum is a representation used in homomorphic signal processing, to convert signals (such as a source and filter) combined by convolution into sums of the their cepstra, for linear separation. In particular, the power cepstrum is often used as a feature vector for representing the human voice and musical signals. For these applications, the spectrum is usually first transformed using the mel scale. The result is called the mel-frequency cepstrum or MFC (its coefficients are called mel-frequency cepstral coefficients, or MFCCs). It is used for voice identification, pitch detection and much more. The cepstrum is useful in these applications because the low-frequency periodic excitation from the vocal cords and the formant filtering of the vocal tract, which convolve in the time domain and multiply in the frequency domain, are additive and in different regions in the quefrency domain.
[edit] Cepstral concepts
The independent variable of a cepstral graph is called the quefrency. The quefrency is a measure of time, though not in the sense of a signal in the time domain. For example, if the sampling rate of an audio signal is 44100 Hz and there is a large peak in the cepstrum whose quefrency is 100 samples, the peak indicates the presence of a pitch that is 44100/100 = 441 Hz. This peak occurs in the cepstrum because the harmonics in the spectrum are periodic, and the period corresponds to the pitch.
[edit] Liftering
Playing further on the anagram theme, a filter that operates on a cepstrum might be called a lifter. A low pass lifter is similar to a low pass filter in the frequency domain. It can be implemented by multiplying by a window in the cepstral domain and when converted back to the time domain, resulting in a smoother signal.
[edit] Convolution
A very important property of the cepstral domain is that the convolution of two signals can be expressed as the addition of their cepstra:
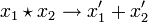
where  = convolution operator.
[edit] References
- ^ B. P. Bogert, M. J. R. Healy, and J. W. Tukey: "The Quefrency Alanysis of Time Series for Echoes: Cepstrum, Pseudo Autocovariance, Cross-Cepstrum and Saphe Cracking". Proceedings of the Symposium on Time Series Analysis (M. Rosenblatt, Ed) Chapter 15, 209-243. New York: Wiley, 1963.
- ^ Norton, Michael; Karczub, Denis (2003). Fundamentals of Noise and Vibration Analysis for Engineers. Cambridge University Press. ISBN 0521499135. http://books.google.com/books?id=jDeRCSqtev4C&pg=PA353&dq=power-cepstrum+log+square+fourier+transform&lr=&as_brr=3&ei=fZT8SMWmCJ-aMu2tzMsL.
- ^ A. V. Oppenheim, "Superposition in a class of nonlinear systems" (Ph.D. dissertation), Res. Lab. Electronics, Massachusetts Institute of Technology, Cambridge, MA, 1965.
- ^ Curtis Roads, "The Computer Music Tutorial", Massachusetts Institute of Technology Press, Cambridge, MA, 1996.
[edit] Further reading
- D. G. Childers, D. P. Skinner, R. C. Kemerait, "The Cepstrum: A Guide to Processing," Proceedings of the IEEE, Vol. 65, No. 10, October 1977, pp. 1428-1443.
- "Speech Signal Analysis"

