Statistics
From Wikipedia, the free encyclopedia
Statistics is a mathematical science pertaining to the collection, analysis, interpretation or explanation, and presentation of data.[1] It also provides tools for prediction and forecasting based on data. It is applicable to a wide variety of academic disciplines, from the natural and social sciences to the humanities, government and business.
Statistical methods can be used to summarize or describe a collection of data; this is called descriptive statistics. In addition, patterns in the data may be modeled in a way that accounts for randomness and uncertainty in the observations, and are then used to draw inferences about the process or population being studied; this is called inferential statistics. Descriptive, and inferential statistics (a.k.a predictive statistics) comprise applied statistics.[2]
There is also a discipline called mathematical statistics, which is concerned with the theoretical basis of the subject. Moreover, there is a branch of statistics called exact statistics that is based on exact probability statements.
The word statistics can either be singular or plural.[3] In its singular form, statistics refers to the mathematical science discussed in this article. In its plural form, statistics is the plural of the word statistic, which refers to a quantity (such as a mean) calculated from a set of data.[4]
Contents |
[edit] History
"Five men, Conring,Achenwall, Süssmilch, Graunt and Petty have been honored by different writers as the founder of statistics." claims one source (Willcox, Walter (1938) The Founder of Statistics. Review of the International Statistical Institute 5(4):321-328.)
Although it was originally thought that statistics were invented in 1662, new research indicates that statistics were actually discovered 6 years earlier. By the time he completed the Down Survey in 1656, William Petty had successfully invented statistics for the first time. In 1685 it was published as "Hiberniae Delineatio."[citation needed]
Some scholars pinpoint the origin of statistics to 1662, with the publication of "Observations on the Bills of Mortality" by John Graunt. Early applications of statistical thinking revolved around the needs of states to base policy on demographic and economic data, hence its stat- etymology. The scope of the discipline of statistics broadened in the early 19th century to include the collection and analysis of data in general. Today, statistics is widely employed in government, business, and the natural and social sciences.
Because of its empirical roots and its applications, statistics is generally considered not to be a subfield of pure mathematics, but rather a distinct branch of applied mathematics. Its mathematical foundations were laid in the 17th century with the development of probability theory by Pascal and Fermat. Probability theory arose from the study of games of chance. The method of least squares was first described by Carl Friedrich Gauss around 1794. The use of modern computers has expedited large-scale statistical computation, and has also made possible new methods that are impractical to perform manually.
[edit] Overview
| This section may require cleanup to meet Wikipedia's quality standards. |
In applying statistics to a scientific, industrial, or societal problem, it is necessary to begin with a process or population to be studied. This might be a population of people in a country, of crystal grains in a rock, or of goods manufactured by a particular factory during a given period. It may instead be a process observed at various times; data collected about this kind of "population" constitute what is called a time series.
For practical reasons, rather than compiling data about an entire population, a chosen subset of the population, called a sample, is studied. Data are collected about the sample in an observational or experimental setting. The data are then subjected to statistical analysis, which serves two related purposes: description and inference.
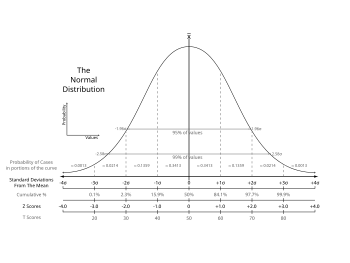
- Descriptive statistics can be used to summarize the data, either numerically or graphically, to describe the sample. Examples of numerical descriptors include the mean and standard deviation for continuous data, such as height, and frequency and percentage for categorical data, such as race.
- Inferential statistics is used to model patterns in the data, accounting for randomness and drawing inferences about the larger population. These inferences may take the form of answers to yes/no questions (hypothesis testing), estimates of numerical characteristics (estimation), descriptions of association (correlation), or modeling of relationships (regression). Other modeling techniques include ANOVA, time series, and data mining.
|
“... it is only the manipulation of uncertainty that interests us. We are not concerned with the matter that is uncertain. Thus we do not study the mechanism of rain; only whether it will rain.”
—Dennis Lindley, "The Philosophy of Statistics", The Statistician (2000).
|
The concept of correlation is particularly noteworthy. Statistical analysis of a data set may reveal that two variables (that is, two properties of the population under consideration) tend to vary together, as if they are connected. For example, a study of annual income and age of death among people might find that poor people tend to have shorter lives than affluent people. The two variables are said to be correlated (which is a positive correlation in this case). However, one cannot immediately infer the existence of a causal relationship between the two variables. (See Correlation does not imply causation.) The correlated phenomena could be caused by a third, previously unconsidered phenomenon, called a lurking variable or confounding variable.
If the sample is representative of the population, then inferences and conclusions made from the sample can be extended to the population as a whole. A major problem lies in determining the extent to which the chosen sample is representative. Statistics offers methods to estimate and correct for randomness in the sample and in the data collection procedure, as well as methods for designing robust experiments in the first place. (See experimental design.)
The fundamental mathematical concept employed in understanding such randomness is probability. Mathematical statistics (also called statistical theory) is the branch of applied mathematics that uses probability theory and analysis to examine the theoretical basis of statistics.
The use of any statistical method is valid only when the system or population under consideration satisfies the basic mathematical assumptions of the method. Misuse of statistics can produce subtle but serious errors in description and interpretation — subtle in the sense that even experienced professionals sometimes make such errors, serious in the sense that they may affect, for instance, social policy, medical practice and the reliability of structures such as bridges. Even when statistics is correctly applied, the results can be difficult for the non-expert to interpret. For example, the statistical significance of a trend in the data, which measures the extent to which the trend could be caused by random variation in the sample, may not agree with one's intuitive sense of its significance. The set of basic statistical skills (and skepticism) needed by people to deal with information in their everyday lives is referred to as statistical literacy.
[edit] Statistical methods
[edit] Experimental and observational studies
A common goal for a statistical research project is to investigate causality, and in particular to draw a conclusion on the effect of changes in the values of predictors or independent variables on dependent variables or response. There are two major types of causal statistical studies: experimental studies and observational studies. In both types of studies, the effect of differences of an independent variable (or variables) on the behavior of the dependent variable are observed. The difference between the two types lies in how the study is actually conducted. Each can be very effective.
An experimental study involves taking measurements of the system under study, manipulating the system, and then taking additional measurements using the same procedure to determine if the manipulation has modified the values of the measurements. In contrast, an observational study does not involve experimental manipulation. Instead, data are gathered and correlations between predictors and response are investigated.
An example of an experimental study is the famous Hawthorne studies, which attempted to test the changes to the working environment at the Hawthorne plant of the Western Electric Company. The researchers were interested in determining whether increased illumination would increase the productivity of the assembly line workers. The researchers first measured the productivity in the plant, then modified the illumination in an area of the plant and checked if the changes in illumination affected the productivity. It turned out that the productivity indeed improved (under the experimental conditions). However, the study is heavily criticized today for errors in experimental procedures, specifically for the lack of a control group and blindness. The Hawthorne effect refers to finding that an outcome (in this case worker productivity) change due to observation itself. Those in the Hawthorn studies became more productive not because the lighting was changed but because they were being observed.
An example of an observational study is a study which explores the correlation between smoking and lung cancer. This type of study typically uses a survey to collect observations about the area of interest and then performs statistical analysis. In this case, the researchers would collect observations of both smokers and non-smokers, perhaps through a case-control study, and then look for the number of cases of lung cancer in each group.
The basic steps of an experiment are;
- Planning the research, including determining information sources, research subject selection, and ethical considerations for the proposed research and method.
- Design of experiments, concentrating on the system model and the interaction of independent and dependent variables.
- Summarizing a collection of observations to feature their commonality by suppressing details. (Descriptive statistics)
- Reaching consensus about what the observations tell about the world being observed. (Statistical inference)
- Documenting / presenting the results of the study.
[edit] Levels of measurement
There are four types of measurements or levels of measurement or measurement scales used in statistics: nominal, ordinal, interval, and ratio. They have different degrees of usefulness in statistical research. Ratio measurements have both a zero value defined and the distances between different measurements defined; they provide the greatest flexibility in statistical methods that can be used for analyzing the data. Interval measurements have meaningful distances between measurements defined, but have no meaningful zero value defined (as in the case with IQ measurements or with temperature measurements in Fahrenheit). Ordinal measurements have imprecise differences between consecutive values, but have a meaningful order to those values. Nominal measurements have no meaningful rank order among values.
Since variables conforming only to nominal or ordinal measurements cannot be reasonably measured numerically, sometimes they are called together as categorical variables, whereas ratio and interval measurements are grouped together as quantitative or continuous variables due to their numerical nature.
[edit] Statistical techniques
Some well known statistical tests and procedures are:
[edit] Specialized disciplines
Some fields of inquiry use applied statistics so extensively that they have specialized terminology. These disciplines include:
- Actuarial science
- Applied information economics
- Biostatistics
- Bootstrap & Jackknife Resampling
- Business statistics
- Chemometrics (for analysis of data from chemistry)
- Data analysis
- Data mining (applying statistics and pattern recognition to discover knowledge from data)
- Demography
- Economic statistics (Econometrics)
- Energy statistics
- Engineering statistics
- Epidemiology
- Geography and Geographic Information Systems, specifically in Spatial analysis
- Image processing
- Psychological statistics
- Quality
- Reliability engineering
- Social statistics
- Statistical literacy
- Statistical modeling
- Statistical surveys
- Structured data analysis (statistics)
- Survival analysis
- Statistics in various sports, particularly baseball and cricket
Statistics form a key basis tool in business and manufacturing as well. It is used to understand measurement systems variability, control processes (as in statistical process control or SPC), for summarizing data, and to make data-driven decisions. In these roles, it is a key tool, and perhaps the only reliable tool.
[edit] Statistical computing
The rapid and sustained increases in computing power starting from the second half of the 20th century have had a substantial impact on the practice of statistical science. Early statistical models were almost always from the class of linear models, but powerful computers, coupled with suitable numerical algorithms, caused an increased interest in nonlinear models (such as neural networks) as well as the creation of new types, such as generalised linear models and multilevel models.
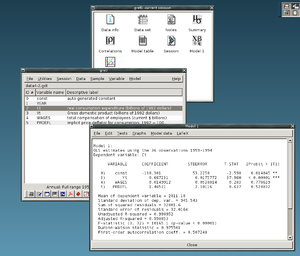
Increased computing power has also led to the growing popularity of computationally-intensive methods based on resampling, such as permutation tests and the bootstrap, while techniques such as Gibbs sampling have made use of Bayesian models more feasible. The computer revolution has implications for the future of statistics with new emphasis on "experimental" and "empirical" statistics. A large number of both general and special purpose statistical software are now available.
[edit] Misuse
There is a general perception that statistical knowledge is all-too-frequently intentionally misused by finding ways to interpret only the data that are favorable to the presenter. A famous saying attributed to Benjamin Disraeli is, "There are three kinds of lies: lies, damned lies, and statistics". Harvard President Lawrence Lowell wrote in 1909 that statistics, "...like veal pies, are good if you know the person that made them, and are sure of the ingredients".
If various studies appear to contradict one another, then the public may come to distrust such studies. For example, one study may suggest that a given diet or activity raises blood pressure, while another may suggest that it lowers blood pressure. The discrepancy can arise from subtle variations in experimental design, such as differences in the patient groups or research protocols, that are not easily understood by the non-expert. (Media reports usually omit this vital contextual information entirely, because of its complexity.)
By choosing (or rejecting, or modifying) a certain sample, results can be manipulated. Such manipulations need not be malicious or devious; they can arise from unintentional biases of the researcher. The graphs used to summarize data can also be misleading.
Deeper criticisms come from the fact that the hypothesis testing approach, widely used and in many cases required by law or regulation, forces one hypothesis (the null hypothesis) to be "favored", and can also seem to exaggerate the importance of minor differences in large studies. A difference that is highly statistically significant can still be of no practical significance. (See criticism of hypothesis testing and controversy over the null hypothesis.)
One response is by giving a greater emphasis on the p-value than simply reporting whether a hypothesis is rejected at the given level of significance. The p-value, however, does not indicate the size of the effect. Another increasingly common approach is to report confidence intervals. Although these are produced from the same calculations as those of hypothesis tests or p-values, they describe both the size of the effect and the uncertainty surrounding it.
[edit] Statistics applied to mathematics or the arts
Traditionally, Statistics was concerned with drawing inferences using a semi standardized methodology that was required learning in most sciences. This has changed with use of Statistics in non-inferential contexts. What was considered to be a dry subject, taken only as a requirement for degrees in many fields, is now viewed enthusiastically. What was derided by some mathematical purists is now considered essential methodology in some areas.
- Scatter plots of data generated by a distribution function may be transformed with familiar tools used in Statistics to reveal underlying patterns, which may lead to hypotheses in number theory.
- Methods of Statistics including predictive methods in forecasting, are combined with chaos theory and fractal geometry to create video works considered to be of beauty. The process art of Jackson Pollock relied on artistic experiments whereby underlying distributions in nature were artistically revealed. With the advent of computers, methods of Statistics were applied to formalize such distribution driven natural processes, in order to make and analyze moving video art.
- Methods of Statistics may be used predicatively, not inferentially in performance art, as in a card trick based on a markov process that only works some of the time, predicted using statistical methodology.
- Statistics is used to predicatively create art, for example in applications of Statistical mechanics with the Statistical or Stochastic music invented by Iannis Xenakis, where the music is performance specific, and does not always come out as expected, but does within a range predicted using Statistics.
[edit] See also
[edit] Notes
- ^ Moses, Lincoln E. Think and Explain with statistics, pp. 1 - 3. Addison-Wesley, 1986.
- ^ Anderson, , D.R.; Sweeney, D.J.; Williams, T.A.. Statistics: Concepts and Applications, pp. 5 - 9. West Publishing Company, 1986.
- ^ "Statistics". Merriam-Webster Online Dictionary. http://www.merriam-webster.com/dictionary/statistics.
- ^ "Statistic". Merriam-Webster Online Dictionary. http://www.merriam-webster.com/dictionary/statistic.
|
|
This article needs additional citations for verification. Please help improve this article by adding reliable references (ideally, using inline citations). Unsourced material may be challenged and removed. (September 2008) |
[edit] References
- Best, Joel (2001). Damned Lies and Statistics: Untangling Numbers from the Media, Politicians, and Activists. University of California Press. ISBN 0-520-21978-3.
- Desrosières, Alain (2004). The Politics of Large Numbers: A History of Statistical Reasoning. Trans. Camille Naish. Harvard University Press. ISBN 0-674-68932-1.
- Hacking, Ian (1990). The Taming of Chance. Cambridge University Press. ISBN 0-521-38884-8.
- Lindley, D.V. (1985). Making Decisions (2nd ed. ed.). John Wiley & Sons. ISBN 0-471-90808-8.
- Tijms, Henk (2004). Understanding Probability: Chance Rules in Everyday life. Cambridge University Press. ISBN 0-521-83329-9.
[edit] External links
![]() Textbooks from Wikibooks
Textbooks from Wikibooks
![]() Quotations from Wikiquote
Quotations from Wikiquote
![]() Source texts from Wikisource
Source texts from Wikisource
![]() Images and media from Commons
Images and media from Commons
![]() News stories from Wikinews
News stories from Wikinews
[edit] Online non-commercial textbooks
- "A New View of Statistics", by Will G. Hopkins, AUT University
- "NIST/SEMATECH e-Handbook of Statistical Methods", by U.S. National Institute of Standards and Technology and SEMATECH
- "Online Statistics: An Interactive Multimedia Course of Study", by David Lane, Joan Lu, Camille Peres, Emily Zitek, et al.
- "The Little Handbook of Statistical Practice", by Gerard E. Dallal, Tufts University
- "StatSoft Electronic Textbook", by StatSoft
[edit] Other non-commercial resources
- Free Statistics (free and open source software, data, and tutorials)
- Probability Web (Carleton College)
- Resources for Teaching and Learning about Probability and Statistics (ERIC)
- Rice Virtual Lab in Statistics (Rice University)
- Statistical Science Web (University of Melbourne)
- Statlib: Data, Software and News (Carnegie Mellon University)
|
|||||
|
|||||||||||||||||||||||||||||||||||||||||||||||||||||||||

