Bass diffusion model
From Wikipedia, the free encyclopedia

The Bass diffusion model was developed by Frank Bass and describes the process of how new products get adopted as an interaction between users and potential users. It has been described as one of the most famous empirical generalisations in marketing, along with the Dirichlet model of repeat buying and brand choice [1]. The model is widely used in forecasting, especially product forecasting and technology forecasting. Mathematically, the basic Bass diffusion is a Riccati equation with constant coefficients.
Frank Bass published his paper "A new product growth model for consumer durables" in 1969. [2] Prior to this, Everett Rogers published Diffusion of Innovations, a highly influential work that described the different stages of product adoption. Bass contributed some mathematical ideas to the concept. [3]
This model has been widely influential in marketing and management science. In 2004 it was selected as one of the ten most frequently cited papers in the 50-year history of Management Science [4]. It was ranked number five, and the only marketing paper in the list. It was subsequently reprinted in the December 2004 issue of Management Science.[4]
Contents |
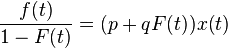
[edit] Model formulation

Where:
 is the rate of change of the installed base fraction
 is the installed base fraction
 is the ultimate market potential
 is the coefficient of innovation
 is the coefficient of imitation
Sales  is the rate of change of installed base (i.e. adoption) multiplied by the ultimate market potential :


The time of peak sales 

[edit] Explanation
The coefficient p is called the coefficient of innovation, external influence or advertising effect. The coefficient q is called the coefficient of imitation, internal influence or word-of-mouth effect.
Typical values of p and q:[5]
- The average value of p has been found to be 0.02, and is often less than 0.01
- The average value of q has been found to be 0.38, with a typical range between 0.3 and 0.5


[edit] Extensions to the model
[edit] Generalised Bass model (with pricing)
Bass found that his model fit the data for almost all product introductions, despite a wide range of managerial decision variable, e.g. pricing and advertising. This means that decision variable can shift the Bass curve in time, but that the shape of the curve is always similar.
Although many extensions of the model have been proposed, only one of these reduces to the Bass model under ordinary circumstances.[4]. This model was developed in 1994 by Frank Bass, Trichy Krishnan and Dipak Jain:
where  is a function of percentage change in price and other variables
[edit] Successive generations
Technology products succeed one another in generations. Norton and Bass extended the model in 1987 for sales of products with continuous repeat purchasing. The formulation for three generations is as follows:[4]
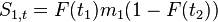


where

 is the incremental number of ultimate adopters of the ith generation product
 is the average (continuous) repeat buying rate among adopters of the ith generation product
 is the time since the introduction of the ith generation product
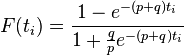
It has been found that the p and q terms are generally the same between successive generations.
[edit] Relationship with other s-curves
There are two special cases of the Bass diffusion model.
- The first special case occurs when q=0, when the model reduces to the Exponential distribution.
- The second special case reduces to the logistic distribution, when p=0.
The Bass model is a special case of the Gamma/shifted Gompertz distribution (G/SG).
Use in online social networks The rapid, recent (as of early 2007) growth in online social networks (and other virtual communities) has led to an increased use of the Bass diffusion model. The Bass diffusion model is used to estimate the size and growth rate of these social networks.
[edit] See also
[edit] References
- ^ Uncles, Mark, Andrew Ehrenberg, and Kathy Hammond (1995), "Patterns of Buyer Behavior: Regularities, Models, and Extensions," Marketing Science, 14 (3, Part 2 of 2), G61-G70.
- ^ a b c d Bass, Frank (1969). "A new product growth model for consumer durables". Management Science 15 (5): p215–227. doi:.
- ^ Management Science 50 Number 12 Supplement, Dec 2004 ISSN 0025-1909 p1833-1840
- ^ a b c d Management Science 15(5) p215
- ^ Mahajan, Vijay; Muller, Eitan and Bass, Frank (1995). "Diffusion of new products: Empirical generalizations and managerial uses". Marketing Science 14 (3): G79–G88. doi:.

