4xplane algebra analysis analysis-data applications calcul charting charts dataviz display graph graphics graphics, graphing gui igorpro infographics information infovis list math mathematics plotting research software statistics tools visualization
List of information graphics software
From Wikipedia, the free encyclopedia
| This article may require cleanup to meet Wikipedia's quality standards. Please improve this article if you can. (June 2008) |
This is a list of software to create any kind of information graphics:
- either includes the ability to create one or more infographics from a provided data set
- either it is provided specifically for information visualization
Contents |
[edit] Computer algebra systems
| Software | Example(s) | Interface | Licence(s) | Operating system | Distinguishing features | |||
|---|---|---|---|---|---|---|---|---|
| License | Open Source (yes/no) | Price | ||||||
| GeoGebra | 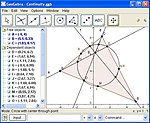 |
GUI | GPL | Yes | Free | Geometry diagrams only | ||
| Kig | GUI | GPL | Yes | Free | Geometry diagrams only | |||
| Maple |  |
GUI, Command line | No | Mac OS X, Linux, Windows | ||||
| MathCad | GUI | No | Windows | Simple GUI driven interface | ||||
| Mathematica |  |
GUI, Command line, C++ | No | Windows, Mac OS X, Linux, HPUX, Solaris | Also a statistics and numerical analysis system with general graphic language | |||
| Maxima | GUI, Command line | GPL | Yes | Free | Linux, Windows, Mac OS X, BSD and Unix Like OS | Various graphical user interfaces, Support LaTex with GNU TeXmacs and Web frontend with SAGE | ||
| SymPy | BSD | Yes | Free | Linux, Mac OS X, WIndows | Python library for computer algebra and symbolic mathematics | |||
[edit] Numerical software
| Software | Example(s) | Interface | Licence(s) | Operating system | Distinguishing features | |||
|---|---|---|---|---|---|---|---|---|
| License | Open Source (yes/no) | Price | ||||||
| Baudline | GUI | proprietary | No, Source available | free | Linux, FreeBSD, Solaris | signal analysis tool | ||
| EJS | GUI | GPL | Yes | Free | Linux, Windows, Mac OS X | Creates ODE solving interactive Java applets. Applets are ready to publish | ||
| FlexPro | proprietary | No | MS Windows only | |||||
| FreeMat | Yes | Free | Lunix, Mac OS X, Windows | |||||
| GNU Octave |  |
GUI, Command line, C, C++, Fortran | GPL | Yes | Free | Linux, Windows, FreeBSD, Solaris, Mac OS X, OS/2 or eComStation | MATLAB compatible, Built-in ODE and DAE solvers, Extensive user contributed toolboxes | |
| LabVIEW | Proprietary | No | ||||||
| Matlab | 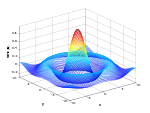 |
Proprietary | No | |||||
| PDL | free | Perl Data Language | ||||||
| S-Lang | ||||||||
| Scilab |  |
CeCILL | Yes | Free | Windows, Linux | |||
| SciPy, NumPy, matplotlib modules for Python | ||||||||
| Sysquake | GUI, command line | proprietary | No | 250$ (LE free) | Linux, Windows, Mac OS X | MATLAB compatible, interactive graphics | ||
[edit] Plotting programs (graphing programs)
| Software | Example(s) | Interface | Licence(s) | Operating system | Distinguishing features | |||
|---|---|---|---|---|---|---|---|---|
| License | Open Source (yes/no) | Price | ||||||
| ChartGizmo | GUI | proprietary | No | Free | Any( internet service) | ChartGizmo service allows to create and publish charts and graphs online | ||
| Descartes (plotting tool) | GUI | GPL | Yes | Free | Any (Python) | Inactive as of 2005 | ||
| EpsTk | Toolkit for use with Matlab and GNU Octave | GPL | Yes | Free | Any (Octave or Matlab) | |||
| GLE | Command line, GUI | BSD / GPL | Yes | Free | Windows, Mac, Linux | Graphics scripting language | ||
| GraphPad Prism | GUI | proprietary | No | academic US$450, student US$300 | Windows, Mac | |||
| Gnuplot | 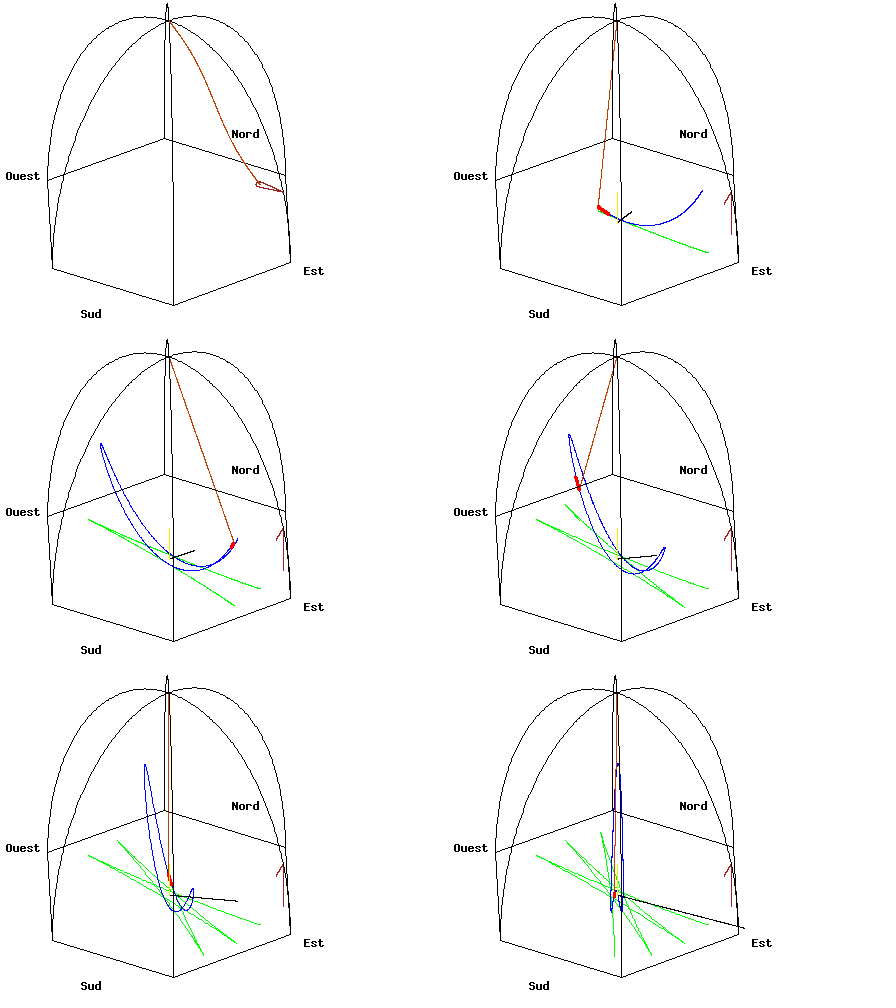 |
Command line, Python, Ruby, Smalltalk | own licence | Yes | Free | Windows, Mac, Linux, VMS, Ultrix, OS/2, MS-DOS, Amiga, OS-9/68k, Atari ST, BeOS | Built in scripting language | |
| Grace |  |
Command line, GUI, various APIs | GPL | Yes | Free | Windows (cygwin), Mac(X11), Linux | Uses Motif; fork of Xmgr | |
| Graph |  |
GUI | GPL | Yes | Free | Windows | ||
| Grapholic | GUI | proprietary | No | US$99[1] | Windows | |||
| HSB Grapher | GUI | proprietary | No | Free | Windows, Linux using Wine | Freeware | ||
| IGOR Pro | GUI | proprietary | No | US$550[1] | Windows, Mac, Linux (wine) | |||
| JFreeChart |  |
GUI, Java, Groovy | LGPL | Yes | Free | Any (Java) | ||
| KaleidaGraph | GUI | proprietary | No | US$200 academic US$140 | Windows MacOS | |||
| KChart |  |
GUI | GPL | Yes | Free | Linux (KDE) | ||
| kst |  |
GUI | GPL | Yes | Free | Linux (KDE) | ||
| LabPlot |  |
GUI, Qt scripting | GPL | Yes | Free | Linux (KDE) | ||
| LiveGraph |  |
GUI | BSD-style | Yes | Free | Any (Java) | Real-time plotting; Point-and-click interface; API for data handling | |
| MatheGrafix |  |
GUI | own license | No | Free | Windows | an interactive function plotter, which allows users to print, present or embed a large variety of graphs in Office documents | |
| MathGV | GUI | No | Free | Windows | Freeware | |||
| GraphEasyRect | GUI | No | Free | Windows,Linux,Mac | Freeware | |||
| Nucalc | GUI | proprietary | No | US$100[1] | Windows, Mac OS, Mac OS X | |||
| OpenPlaG |  |
GUI | GPL | Yes | Free | Any (PHP 5) | graph plotter | |
| Origin |  |
GUI, COM, C/C++ and scripting | proprietary | No | US$ 950(std) 1500 (pro) 50(student)[1] |
Windows | sparklines above worksheet data columns | |
| PGPLOT | FORTRAN, C | No | Free for non commercial | Windows, Mac, Linux (Fortran) California Institute of Technology | Inactive as of 2001 | |||
| Physics Plot | GUI | proprietary | No | US$100 | Windows (visualbasic) | |||
| ploticus |  |
Command line, C | GPL | Yes | Free | Windows, Mac, Linux | plots and charts from data | |
| QtiPlot | GUI | GPL | Yes | free if compiled from source | Windows, Mac, Linux | |||
| ROOT |  |
GUI, C++, Python, Ruby | LGPL | Yes | Free | Windows, Mac, Linux | ||
| SciDAVis | 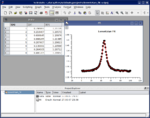 |
GUI, Python | GPL | Yes | Free | Windows, Mac, Linux | Qt4-based GUI, Python scriptable | |
| SigmaPlot | GUI | proprietary | No | US$749[1] | Windows | |||
| surf | commind line, GUI | GPL | Yes | real algebraic geometry vizualization: plotting plane algebraic curves and algebraic surfaces in R^3, ray tracing, transparency (Surf home page) | ||||
| SURFER | GUI | GPL | Yes | derivative of surf (Surfer home page) | ||||
| Turbo Plot | GUI | proprietary | No | Free | Windows | x86/x64, Vectored Plots. | ||
| Veusz homepage | 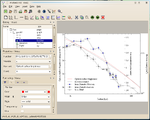 |
GUI, Python, Command line | GPL | Yes | Free | Unix, Windows, Mac | Create publication-quality PS/PDF plots | |
| Visifire | Independent of Server side Scripting | GPL | Yes | Free | Windows, Mac | |||
[edit] Statistical software
| Software | Example(s) | Interface | Licence(s) | Operating system | Distinguishing features | ||
|---|---|---|---|---|---|---|---|
| License | Open Source (yes/no) | Price | |||||
| DAP | |||||||
| Epi Info | |||||||
| EViews | Proprietary | No | |||||
| gretl | GUI | GPL | Yes | Free | Linux, Mac, Windows | Specialized in econometrics and time series analyses, built-in scripting language, interface to gnuplot and R | |
| PSPP | |||||||
| QI Macros | No | $139 | Excel Add in | Control Chart Wizard analyzes your data and selects the right chart for you | |||
| MedCalc | Gui | Proprietary | No | $395 | Windows | ||
| R | GPL | Yes | Free | Linux, Mac, Windows | Great interoperability with other free software packages. | ||
| S-PLUS | Proprietary | No | |||||
| S-Lang | |||||||
| Statistical Lab | |||||||
| SAS System | Proprietary | No | |||||
| SPSS | Gui, Command Line | Proprietary | No | ||||
| Statgraphics | Gui | Proprietary | No | $695 | Windows | Statistical software package for exploratory data analysis, statistical modeling, design of experiments, time series forecasting, quality improvement and Six Sigma. | |
| Stata | Proprietary | No | |||||
| Systat | Proprietary | No | |||||
| SOCR | |||||||
[edit] Spreadsheets
Graphing functionality is included in almost all spreadsheet programs. Some well-known examples are:
Some online spreadsheets also support charting:
- EditGrid
- iRows
- Zoho Office Suite spreadsheet
[edit] Vector graphics
Vector graphics software can be used for manual graphing or for editing the output of another program. Please see:
- Category:Vector graphics editors
- List of vector graphics editors
- Comparison of vector graphics editors

