Bresenham's line algorithm
From Wikipedia, the free encyclopedia
|
|
This article may require cleanup to meet Wikipedia's quality standards. Please improve this article if you can. (December 2008) |
|
|
This article may be confusing or unclear to readers. Please help clarify the article; suggestions may be found on the talk page. (December 2008) |
|
|
This article is in need of attention from an expert on the subject. Please help recruit one or improve this article yourself. See the talk page for details. Please consider using {{Expert-subject}} to associate this request with a WikiProject. (December 2008) |
The Bresenham line algorithm is an algorithm which determines which points in an n-dimensional raster should be plotted in order to form a close approximation to a straight line between two given points. It is commonly used to draw lines on a computer screen, as it uses only integer addition, subtraction and bit shifting all of which are very cheap operations in standard computer architectures. It is one of the earliest algorithms developed in the field of computer graphics.
Through a minor expansion, the original algorithm for lines can also be used to draw circles. Also this can be done with simple arithmetic operations; quadratic or trigonometric expressions can be avoided or recursively dissolved into simpler steps.
The mentioned properties make it still an important algorithm, and it is used among others in plotters, in graphics chips of modern graphics cards, and in many graphics libraries. Because the algorithm is very simple, it is often implemented in both the firmware and the hardware of graphics cards.
The label "Bresenham" is today often used for a whole family of algorithms, which have been developed by others, later, yet in succession of Bresenham and with a similar basic approach. See deeper references below.
Contents |
[edit] The algorithm
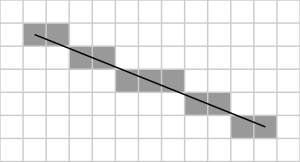
The common conventions that pixel coordinates increase in the down and right directions and that pixel centers have integer coordinates will be used. The endpoints of the line are the pixels at (x0, y0) and (x1, y1), where the first coordinate of the pair is the column and the second is the row.
The algorithm will be initially presented only for the octant in which the segment goes down and to the right (x0≤x1 and y0≤y1), and its horizontal projection x1 − x0 is longer than the vertical projection y1 − y0 (in other words, the line has a slope less than 1 and greater than 0.) In this octant, for each column x between x0 and x1, there is exactly one row y (computed by the algorithm) containing a pixel of the line, while each row between y0 and y1 may contain multiple rasterized pixels.
Bresenham's algorithm chooses the integer y corresponding to the pixel center that is closest to the ideal (fractional) y for the same x; on successive columns y can remain the same or increase by 1. The general equation of the line through the endpoints is given by:

Since we know the column, x, the pixel's row, y, is given by rounding this quantity to the nearest integer:

The slope (y1 − y0) / (x1 − x0) depends on the endpoint coordinates only and can be precomputed, and the ideal y for successive integer values of x can be computed starting from y0 and repeatedly adding the slope.
In practice, the algorithm can track, instead of possibly large y values, a small error value between −0.5 and 0.5: the vertical distance between the rounded and the exact y values for the current x. Each time x is increased, the error is increased by the slope; if it exceeds 0.5, the rasterization y is increased by 1 (the line continues on the next lower row of the raster) and the error is decremented by 1.0.
In the following pseudocode sample plot(x,y) plots a point and abs returns absolute value:
 function line(x0, x1, y0, y1)
     int deltax := x1 - x0
     int deltay := y1 - y0
     real error := 0
     real deltaerr := deltay / deltax    // Assume deltax != 0 (line is not vertical),
           // note that this division needs to be done in a way that preserves the fractional part
     int y := y0
     for x from x0 to x1
         plot(x,y)
         error := error + deltaerr
         if abs(error) ≥ 0.5 then
             y := y + 1
             error := error - 1.0
[edit] Generalization
The version above only handles lines that descend to the right. We would of course like to be able to draw all lines. The first case is allowing us to draw lines that still slope downwards but head in the opposite direction. This is a simple matter of swapping the initial points if x0 > x1. Trickier is determining how to draw lines that go up. To do this, we check if y0 ≥ y1; if so, we step y by -1 instead of 1. Lastly, we still need to generalize the algorithm to drawing lines in all directions. Up until now we have only been able to draw lines with a slope less than one. To be able to draw lines with a steeper slope, we take advantage of the fact that a steep line can be reflected across the line y=x to obtain a line with a small slope. The effect is to switch the x and y variables throughout, including switching the parameters to plot. The code looks like this:
 function line(x0, x1, y0, y1)
     boolean steep := abs(y1 - y0) > abs(x1 - x0)
     if steep then
         swap(x0, y0)
         swap(x1, y1)
     if x0 > x1 then
         swap(x0, x1)
         swap(y0, y1)
     int deltax := x1 - x0
     int deltay := abs(y1 - y0)
     real error := 0
     real deltaerr := deltay / deltax
     int ystep
     int y := y0
     if y0 < y1 then ystep := 1 else ystep := -1
     for x from x0 to x1
         if steep then plot(y,x) else plot(x,y)
         error := error + deltaerr
         if error ≥ 0.5 then
             y := y + ystep
             error := error - 1.0
The function now handles all lines and implements the complete Bresenham's algorithm.
[edit] Optimization
The problem with this approach is that computers operate relatively slowly on fractional numbers like error and deltaerr; moreover, errors can accumulate over many floating-point additions. Working with integers will be both faster and more accurate. The trick we use is to multiply all the fractional numbers above by deltax, which enables us to express them as integers. The only problem remaining is the constant 0.5—to deal with this, we change the initialization of the variable error, and invert it for an additional small optimization. The new program looks like this:
 function line(x0, x1, y0, y1)
     boolean steep := abs(y1 - y0) > abs(x1 - x0)
     if steep then
         swap(x0, y0)
         swap(x1, y1)
     if x0 > x1 then
         swap(x0, x1)
         swap(y0, y1)
     int deltax := x1 - x0
     int deltay := abs(y1 - y0)
     int error := deltax / 2
     int ystep
     int y := y0
     if y0 < y1 then ystep := 1 else ystep := -1
     for x from x0 to x1
         if steep then plot(y,x) else plot(x,y)
         error := error - deltay
         if error < 0 then
             y := y + ystep
             error := error + deltax
The following is a C++ implementation of the above, with an additional variable xstep used in place of the swap, such that the line is always drawn from the starting point to the ending point (critical in plotter and CNC applications). Definitions of SWAP(x, y) (x ^= y ^= x ^= y) are provided for efficiency.
void line(int x0, int y0, int x1, int y1) {
   int Dx = x1 - x0;
   int Dy = y1 - y0;
   int steep = (abs(Dy) >= abs(Dx));
   if (steep) {
       SWAP(x0, y0);
       SWAP(x1, y1);
       // recompute Dx, Dy after swap
       Dx = x1 - x0;
       Dy = y1 - y0;
   }
   int xstep = 1;
   if (Dx < 0) {
       xstep = -1;
       Dx = -Dx;
   }
   int ystep = 1;
   if (Dy < 0) {
       ystep = -1;
       Dy = -Dy;
   }
   int TwoDy = 2*Dy;
   int TwoDyTwoDx = TwoDy - 2*Dx; // 2*Dy - 2*Dx
   int E = TwoDy - Dx; //2*Dy - Dx
   int y = y0;
   int xDraw, yDraw;
   for (int x = x0; x != x1; x += xstep) {
       if (steep) {
           xDraw = y;
           yDraw = x;
       } else {
           xDraw = x;
           yDraw = y;
       }
       // plot
       plot(xDraw, yDraw);
       // next
       if (E > 0) {
           E += TwoDyTwoDx; //E += 2*Dy - 2*Dx;
           y = y + ystep;
       } else {
           E += TwoDy; //E += 2*Dy;
       }
   }
}
Here is another way to implement:
//another optimized implementation version

//
// generate x,y coordinates to draw a line from
// x0,y0 to x1,y1 and output the coordinates in
// the same direction that they are drawn.
// any coordinates which overlap other coordinates
// are duplicates and are removed from the output
// because they are redundant.
//

int idx, dupe; // declared external

void line(int x0, int y0, int x1, int y1)
{
    int x, cx, deltax, xstep,
        y, cy, deltay, ystep,
        n, error, st;

    // find largest delta for pixel steps
    st = (abs(y1 - y0) > abs(x1 - x0));

    // if deltay > deltax then swap x,y
    if (st) {
        (x0 ^= y0); (y0 ^= x0); (x0 ^= y0); // swap(x0, y0);
        (x1 ^= y1); (y1 ^= x1); (x1 ^= y1); // swap(x1, y1);
    }

    deltax = abs(x1 - x0);
    deltay = abs(y1 - y0);
    error  = (deltax / 2);
    y = y0;

    if (x0 > x1) { xstep = -1; }
    else         { xstep =  1; }

    if (y0 > y1) { ystep = -1; }
    else         { ystep =  1; }

    for ((x = x0); (x != (x1 + xstep)); (x += xstep))
    {
        (cx = x); (cy = y); // copy of x, copy of y

        // if x,y swapped above, swap them back now
        if (st) { (cx ^= cy); (cy ^= cx); (cx ^= cy); }

        (dupe = 0); // initialize no dupe

        for ((n = 0); (n < idx); (n++)) {
            if((cx == accx[n]) && (cy == accy[n])) {
                (dupe = 1); // found a dupe - flag it
                break;
            }
        }

        // record current x,y for later dupe check
        (accx[idx] = cx); (accy[idx] = cy); (idx++);

        if(!dupe) { // if not a dupe, write it out
            fprintf(stdout, "X=%2d, Y=%2d\n", cx, cy);
            fflush(stdout); }
        else {
//            fprintf(stdout, "; Duplicate: X=%2d, Y=%2d\n", cx, cy); // debug
//            fflush(stdout);
        }

        (error -= deltay); // converge toward end of line

        if (error < 0) { // not done yet
            (y += ystep);
            (error += deltax);
        }
    }
}
[edit] History
The algorithm was developed by Jack E. Bresenham in 1962 at IBM. In 2001 Bresenham wrote[1]:
- "I was working in the computation lab at IBM's San Jose development lab. A Calcomp plotter had been attached to an IBM 1401 via the 1407 typewriter console. [The algorithm] was in production use by summer 1962, possibly a month or so earlier. Programs in those days were freely exchanged among corporations so Calcomp (Jim Newland and Calvin Hefte) had copies. When I returned to Stanford in Fall 1962, I put a copy in the Stanford comp center library.
- A description of the line drawing routine was accepted for presentation at the 1963 ACM national convention in Denver, Colorado. It was a year in which no proceedings were published, only the agenda of speakers and topics in an issue of Communications of the ACM. A person from the IBM Systems Journal asked me after I made my presentation if they could publish the paper. I happily agreed, and they printed it in 1965."
Bresenham's algorithm was later modified to produce circles, the resulting algorithm being sometimes known as either "Bresenham's circle algorithm" or Midpoint circle algorithm.
[edit] Similar algorithms
The Bresenham algorithm can be interpreted as slightly modified DDA (Using 0.5 as error threshold instead of 0, which is required for non-overlapping polygon rasterizing).
The principle of using an incremental error in place of division operations has other applications in graphics. It is possible to use this technique to calculate the U,V co-ordinates during raster scan of texture mapped polygons. The voxel heightmap software-rendering engines seen in some PC games also used this principle.
Bresenham also published a Run-Slice (as opposed to the Run-Length) computational algorithm.
[edit] See also
- Digital Differential Analyzer (graphics algorithm) is a simple and general method for rasterizing lines and triangles.
- Xiaolin Wu's line algorithm, a similarly fast method of drawing lines with antialiasing.
- Midpoint circle algorithm, a similar algorithm for drawing circles.
[edit] Further reading
- Patrick-Gilles Maillot's Thesis an extension of the Bresenham line drawing algorithm to perform 3D hidden lines removal; also published in MICAD '87 proceedings on CAD/CAM and Computer Graphics, page 591 - ISBN 2-86601-084-1.
[edit] Notes
- ^ Paul E. Black. Dictionary of Algorithms and Data Structures, NIST. http://www.nist.gov/dads/HTML/bresenham.html
[edit] References
- Jack E. Bresenham, "Algorithm for computer control of a digital plotter", IBM Systems Journal, Vol. 4, No.1, January 1965, pp. 25–30
- "The Bresenham Line-Drawing Algorithm", by Colin Flanagan

