%5Bwikipedia_article%5D 2d algorithm algorithms biocomplexity bioinformatics clusteranalysis clustering colint datamining dendrogram geometry graph hierarchical hierarchy image math network random space technique thesis topology tree usability ux visualization
Dendrogram
From Wikipedia, the free encyclopedia
A dendrogram (from Greek dendron "tree", -gramma "drawing") is a tree diagram frequently used to illustrate the arrangement of the clusters produced by a clustering algorithm. Dendrograms are often used in computational biology to illustrate the clustering of genes.
For a clustering example, suppose this data is to be clustered using Euclidean distance as the distance metric.
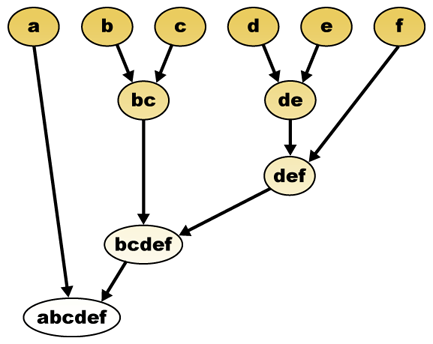
The hierarchical clustering dendrogram would be as such:
Here the top row of nodes represent data, and the remaining nodes represent the clusters to which the data belong, and the arrows represent the distance.


