Enzyme kinetics
From Wikipedia, the free encyclopedia
Enzyme kinetics is the study of the chemical reactions that are catalysed by enzymes, with a focus on their reaction rates. The study of an enzyme's kinetics reveals the catalytic mechanism of this enzyme, its role in metabolism, how its activity is controlled, and how a drug or a poison might inhibit the enzyme.
Enzymes are usually protein molecules that manipulate other molecules — the enzymes' substrates. These target molecules bind to an enzyme's active site and are transformed into products through a series of steps known as the enzymatic mechanism. These mechanisms can be divided into single-substrate and multiple-substrate mechanisms. Kinetic studies on enzymes that only bind one substrate, such as triosephosphate isomerase, aim to measure the affinity with which the enzyme binds this substrate and the turnover rate.
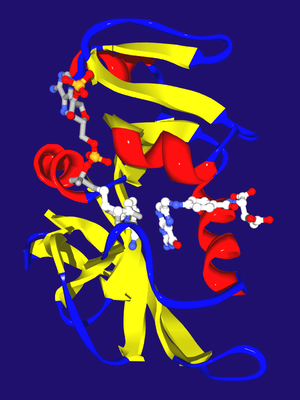
When enzymes bind multiple substrates, such as dihydrofolate reductase (shown right), enzyme kinetics can also show the sequence in which these substrates bind and the sequence in which products are released. An example of enzymes that bind a single substrate and release multiple products are proteases, which cleave one protein substrate into two polypeptide products. Others join two substrates together, such as DNA polymerase linking a nucleotide to DNA. Although these mechanisms are often a complex series of steps, there is typically one rate-determining step that determines the overall kinetics. This rate-determining step may be a chemical reaction or a conformational change of the enzyme or substrates, such as those involved in the release of product(s) from the enzyme.
Knowledge of the enzyme's structure is helpful in interpreting the kinetic data. For example, the structure can suggest how substrates and products bind during catalysis; what changes occur during the reaction; and even the role of particular amino acid residues in the mechanism. Some enzymes change shape significantly during the mechanism; in such cases, it is helpful to determine the enzyme structure with and without bound substrate analogs that do not undergo the enzymatic reaction.
Not all biological catalysts are protein enzymes; RNA-based catalysts such as ribozymes and ribosomes are essential to many cellular functions, such as RNA splicing and translation. The main difference between ribozymes and enzymes is that the RNA catalysts perform a more limited set of reactions, although their reaction mechanisms and kinetics can be analysed and classified by the same methods.
Contents |
[edit] General principles

The reaction catalysed by an enzyme uses exactly the same reactants and produces exactly the same products as the uncatalysed reaction. Like other catalysts, enzymes do not alter the position of equilibrium between substrates and products.[1] However, unlike uncatalysed chemical reactions, enzyme-catalysed reactions display saturation kinetics. For a given enzyme concentration and for relatively low substrate concentrations, the reaction rate increases linearly with substrate concentration; the enzyme molecules are largely free to catalyze the reaction, and increasing substrate concentration means an increasing rate at which the enzyme and substrate molecules encounter one another. However, at relatively high substrate concentrations, the reaction rate asymptotically approaches the theoretical maximum; the enzyme active sites are almost all occupied and the reaction rate is determined by the intrinsic turnover rate of the enzyme. The substrate concentration midway between these two limiting cases is denoted by KM.
The two most important kinetic properties of an enzyme are how quickly the enzyme becomes saturated with a particular substrate, and the maximum rate it can achieve. Knowing these properties suggests what an enzyme might do in the cell and can show how the enzyme will respond to changes in these conditions.
[edit] Enzyme assays

Enzyme assays are laboratory procedures that measure the rate of enzyme reactions. Because enzymes are not consumed by the reactions they catalyse, enzyme assays usually follow changes in the concentration of either substrates or products to measure the rate of reaction. There are many methods of measurement. Spectrophotometric assays observe change in the absorbance of light between products and reactants; radiometric assays involve the incorporation or release of radioactivity to measure the amount of product made over time. Spectrophotometric assays are most convenient since they allow the rate of the reaction to be measured continuously. Although radiometric assays require the removal and counting of samples (i.e., they are discontinuous assays) they are usually extremely sensitive and can measure very low levels of enzyme activity.[2] An analogous approach is to use mass spectrometry to monitor the incorporation or release of stable isotopes as substrate is converted into product.
The most sensitive enzyme assays use lasers focused through a microscope to observe changes in single enzyme molecules as they catalyse their reactions. These measurements either use changes in the fluorescence of cofactors during an enzyme's reaction mechanism, or of fluorescent dyes added onto specific sites of the protein to report movements that occur during catalysis.[3] These studies are providing a new view of the kinetics and dynamics of single enzymes, as opposed to traditional enzyme kinetics, which observes the average behaviour of populations of millions of enzyme molecules.[4][5]
On the left is shown a typical progress curve for an enzyme assay. The enzyme produces product at a linear initial rate at the start of the reaction. Later in this progress curve, the rate slows down as substrate is used up or products accumulate. The length of the initial rate period depends on the assay conditions and can range from milliseconds to hours. Enzyme assays are usually set up to produce an initial rate lasting over a minute, to make measurements easier. However, equipment for rapidly mixing liquids allows fast kinetic measurements on initial rates of less than one second.[6] These very rapid assays are essential for measuring pre-steady-state kinetics, which are discussed below.
Most enzyme kinetics studies concentrate on this initial, linear part of enzyme reactions. However, it is also possible to measure the complete reaction curve and fit this data to a non-linear rate equation. This way of measuring enzyme reactions is called progress-curve analysis.[7] This approach is useful as an alternative to rapid kinetics when the initial rate is too fast to measure accurately.
[edit] Single-substrate reactions
Enzymes with single-substrate mechanisms include isomerases such as triosephosphateisomerase or bisphosphoglycerate mutase, intramolecular lyases such as adenylate cyclase and the hammerhead ribozyme, a RNA lyase.[8] However, some enzymes that only have a single substrate do not fall into this category of mechanisms. Catalase is an example of this, as the enzyme reacts with a first molecule of hydrogen peroxide substrate, becomes oxidised and is then reduced by a second molecule of substrate. Although a single substrate is involved, the existence of a modified enzyme intermediate means that the mechanism of catalase is actually a ping–pong mechanism, a type of mechanism that is discussed in the Multi-substrate reactions section below.
[edit] Michaelis–Menten kinetics


As enzyme-catalysed reactions are saturable, their rate of catalysis does not show a linear response to increasing substrate. If the initial rate of the reaction is measured over a range of substrate concentrations (denoted as [S]), the reaction rate (v) increases as [S] increases, as shown on the right. However, as [S] gets higher, the enzyme becomes saturated with substrate and the rate reaches Vmax, the enzyme's maximum rate.
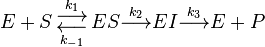
The Michaelis-Menten kinetic model of a single-substrate reaction is shown on the right. There is an initial bimolecular reaction between the enzyme E and substrate S to form the enzyme–substrate complex ES. Although the enzymatic mechanism for the unimolecular reaction  reaction can be quite complex, there is typically one rate-determining enzymatic step that allows this reaction to be modelled as a single catalytic step with an apparent unimolecular rate constant kcat. If the reaction path proceeds over one or several intermediates, kcat will be a function of several elementary rate constants, whereas in the simplest case of an single elementary reaction reaction (e.g. no intermediates) it will be identical to the elementary unimolecular rate constant k2. The apparent unimolecular rate constant kcat is also called turnover number and denotes the maximum number of enzymatic reactions catalyzed per second.
The Michaelis–Menten equation[9] describes how the (initial) reaction rate v0 depends on the position of the substrate-binding equilibrium and the rate constant k2.
![v_0 = \frac{V_\max[\mbox{S}]}{K_M + [\mbox{S}]}](http://upload.wikimedia.org/math/9/e/8/9e887f652080baeae3236523f4316445.png) (Michaelis-Menten equation)
(Michaelis-Menten equation)
with the constants
![\begin{align}
K_M \ &\stackrel{\mathrm{def}}{=}\ \frac{k_{2} + k_{-1}}{k_{1}} \approx K_D\\
V_\max \ &\stackrel{\mathrm{def}}{=}\ k_{cat}{[}E{]}_{tot}
\end{align}](http://upload.wikimedia.org/math/7/c/c/7cc86c5f51e917dfb3b517c937089935.png)
This Michaelis-Menten equation is the basis for most single-substrate enzyme kinetics. Two crucial assumptions underlie this equation (apart from the general assumption about the mechanism only involving no intermediate or product inhibition, and there is no allostericity or cooperativity). The first assumption is the so called quasi-steady-state assumption (or pseudo-steady-state hypothesis), namely that the concentration of the substrate-bound enzyme (and hence also the unbound enzyme) changes much more slowly than those of the product and substrate and thus the change over time of the complex can be set to zero ![d{[}ES{]}/{dt} \; \overset{!} = \;0](http://upload.wikimedia.org/math/0/8/f/08f59e2b77fc9b255da74af77b16dc0a.png) . The second assumption is that the total enzyme concentration does not change over time, thus
. The second assumption is that the total enzyme concentration does not change over time, thus ![{[}E{]}_\text{tot} = {[}E{]} + {[}ES{]} \; \overset{!} = \; \text{const}](http://upload.wikimedia.org/math/4/6/6/4667651f6f6d82a0c5bef9130f3af073.png) . A complete derivation can be found here.
. A complete derivation can be found here.
The Michaelis constant KM is experimentally defined as the concentration at which the rate of the enzyme reaction is half Vmax, which can be verified by substituting [S] = Km into the Michaelis-Menten equation and can be seen graphically too. If the rate-determining enzymatic step is slow compared to substrate dissociation ( ), the Michaelis constant KM is roughly the dissociation constant KD of the ES complex.
If [S] is small compared to KM then the term ![[S] / (K_M + [S]) \approx [S] / K_M](http://upload.wikimedia.org/math/7/0/7/7071e21a580398420d8e6bd0673ea3df.png) and also very little ES complex is formed, thus
and also very little ES complex is formed, thus ![[E]_0 \approx [E]](http://upload.wikimedia.org/math/0/f/9/0f92ba855b6682e83c7195e3899887be.png) . Therefore, the rate of product formation is
. Therefore, the rate of product formation is
![v_0 \approx \frac{k_{cat}}{K_M} [E] [S] \qquad \qquad \text{if } [S] \ll K_M](http://upload.wikimedia.org/math/8/7/2/87214feb1ac3e7a5919b4e60a9ed3ddb.png)
Thus the product formation rate depends on the enzyme concentration as well as on the substrate concentration, the equation resembles a bimolecular reaction with a corresponding pseudo-second order rate constant k2 / KM. This constant is a measure of catalytic efficiency. The most efficient enzymes reach a k2 / KM in the range of 108 - 1010 M−1 s−1. These enzymes are so efficient they effectively catalyze a reaction each time they encounter a substrate molecule and have thus reached an upper theoretical limit for efficiency (diffusion limit); these enzymes have often been termed perfect enzymes.[10]
[edit] Linear plots of the Michaelis-Menten equation
Using an interactive Michaelis–Menten kinetics tutorial at the University of Virginia,[α] the effects on the behaviour of an enzyme of varying kinetic constants can be explored.
The plot of v versus [S] above is not linear; although initially linear at low [S], it bends over to saturate at high [S]. Before the modern era of nonlinear curve-fitting on computers, this nonlinearity could make it difficult to estimate Km and Vmax accurately. Therefore, several researchers developed linearizations of the Michaelis-Menten equation, such as the Lineweaver–Burk plot, the Eadie-Hofstee diagram and the Hanes-Woolf plot. All of these linear representations can be useful for visualizing data, but none should be used to determine kinetic parameters, as computer software is readily available that allows for more accurate determination by nonlinear regression methods.[11]
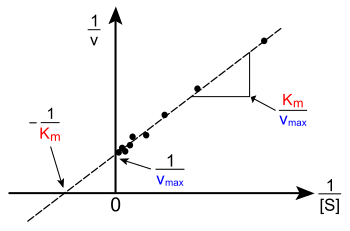
The Lineweaver–Burk plot or double reciprocal plot is a common way of illustrating kinetic data. This is produced by taking the reciprocal of both sides of the Michaelis–Menten equation. As shown on the right, this is a linear form of the Michaelis–Menten equation and produces a straight line with the equation y = mx + c with a y-intercept equivalent to 1/Vmax and an x-intercept of the graph representing -1/Km.
![\frac{1}{v} = \frac{K_{m}}{V_\max [\mbox{S}]} + \frac{1}{V_\max}](http://upload.wikimedia.org/math/2/6/f/26f8f72dacb153e17f74103263d02928.png)
Naturally, no experimental values can be taken at negative 1/[S]; the lower limiting value 1/[S] = 0 (the y-intercept) corresponds to an infinite substrate concentration, where 1/v=1/Vmax as shown at the right; thus, the x-intercept is an extrapolation of the experimental data taken at positive concentrations. More generally, the Lineweaver–Burk plot skews the importance of measurements taken at low substrate concentrations and, thus, can yield inaccurate estimates of Vmax and Km.[12] A more accurate linear plotting method is the Eadie-Hofstee plot. In this case, v is plotted against v/[S]. In the third common linear representation, the Hanes-Woolf plot, [S]/v is plotted against [S]. In general, data normalisation can help diminish the amount of experimental work and can increase the reliability of the output, and is suitable for both graphical and numerical analysis.[13]
[edit] Practical significance of kinetic constants
The study of enzyme kinetics is important for two basic reasons. Firstly, it helps explain how enzymes work, and secondly, it helps predict how enzymes behave in living organisms. The kinetic constants defined above, Km and Vmax, are critical to attempts to understand how enzymes work together to control metabolism.
Making these predictions is not trivial, even for simple systems. For example, oxaloacetate is formed by malate dehydrogenase within the mitochondrion. Oxaloacetate can then be consumed by citrate synthase, phosphoenolpyruvate carboxykinase or aspartate aminotransferase, feeding into the citric acid cycle, gluconeogenesis or aspartic acid biosynthesis, respectively. Being able to predict how much oxaloacetate goes into which pathway requires knowledge of the concentration of oxaloacetate as well as the concentration and kinetics of each of these enzymes. This aim of predicting the behaviour of metabolic pathways reaches its most complex expression in the synthesis of huge amounts of kinetic and gene expression data into mathematical models of entire organisms. Although this goal is far in the future for any eukaryote, attempts are now being made to achieve this in bacteria, with models of Escherichia coli metabolism now being produced and tested.[14][15]
[edit] Michaelis Menten kinetics with intermediate
One could also consider the less simple case
where an complex with the enzyme and an intermediate exists and the intermediate is converted into product in a second step. In this case we have a very similar equation[16]
![\begin{align}
v_0 &= k_{cat}\frac{{[}S{]} {[}E{]}_0}{K_M^{\prime}+ {[}S{]}}
\end{align}](http://upload.wikimedia.org/math/6/0/9/609a1bff6d5254c7a6aa0330a5f5a0b4.png)
but the constants are different
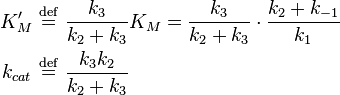
We see that for the limiting case  , thus when the last step from EI to E + P is much faster than the previous step, we get again the original equation. Mathematically we have then
  and
and  .
.
[edit] Multi-substrate reactions
Multi-substrate reactions follow complex rate equations that describe how the substrates bind and in what sequence. The analysis of these reactions is much simpler if the concentration of substrate A is kept constant and substrate B varied. Under these conditions, the enzyme behaves just like a single-substrate enzyme and a plot of v by [S] gives apparent Km and Vmax constants for substrate B. If a set of these measurements is performed at different fixed concentrations of A, these data can be used to work out what the mechanism of the reaction is. For an enzyme that takes two substrates A and B and turns them into two products P and Q, there are two types of mechanism: ternary complex and ping–pong.
[edit] Ternary-complex mechanisms

In these enzymes, both substrates bind to the enzyme at the same time to produce an EAB ternary complex. The order of binding can either be random (in a random mechanism) or substrates have to bind in a particular sequence (in an ordered mechanism). When a set of v by [S] curves (fixed A, varying B) from an enzyme with a ternary-complex mechanism are plotted in a Lineweaver–Burk plot, the set of lines produced will intersect.
Enzymes with ternary-complex mechanisms include glutathione S-transferase,[17] dihydrofolate reductase[18] and DNA polymerase.[19] The following links show short animations of the ternary-complex mechanisms of the enzymes dihydrofolate reductase[β] and DNA polymerase[γ].
[edit] Ping–pong mechanisms
As shown on the right, enzymes with a ping-pong mechanism can exist in two states, E and a chemically modified form of the enzyme E*; this modified enzyme is known as an intermediate. In such mechanisms, substrate A binds, changes the enzyme to E* by, for example, transferring a chemical group to the active site, and is then released. Only after the first substrate is released can substrate B bind and react with the modified enzyme, regenerating the unmodified E form. When a set of v by [S] curves (fixed A, varying B) from an enzyme with a ping–pong mechanism are plotted in a Lineweaver–Burk plot, a set of parallel lines will be produced.
Enzymes with ping–pong mechanisms include some oxidoreductases such as thioredoxin peroxidase,[20] transferases such as acylneuraminate cytydilyltransferase[21] and serine proteases such as trypsin and chymotrypsin.[22] Serine proteases are a very common and diverse family of enzymes, including digestive enzymes (trypsin, chymotrypsin, and elastase), several enzymes of the blood clotting cascade and many others. In these serine proteases, the E* intermediate is an acyl-enzyme species formed by the attack of an active site serine residue on a peptide bond in a protein substrate. A short animation showing the mechanism of chymotrypsin is linked here.[δ]
[edit] Non-Michaelis–Menten kinetics

Some enzymes produce a sigmoid v by [S] plot, which often indicates cooperative binding of substrate to the active site. This means that the binding of one substrate molecule affects the binding of subsequent substrate molecules. This behavior is most common in multimeric enzymes with several interacting active sites.[23] Here, the mechanism of cooperation is similar to that of haemoglobin, with binding of substrate to one active site altering the affinity of the other active sites for substrate molecules. Positive cooperativity occurs when binding of the first substrate molecule increases the affinity of the other active sites for substrate. Negative cooperativity occurs when binding of the first substrate decreases the affinity of the enzyme for other substrate molecules.
Allosteric enzymes include mammalian tyrosyl tRNA-synthetase, which shows negative cooperativity,[24] and bacterial aspartate transcarbamoylase[25] and phosphofructokinase[26], which show positive cooperativity.
Cooperativity is surprisingly common and can help regulate the responses of enzymes to changes in the concentrations of their substrates. Positive cooperativity makes enzymes much more sensitive to [S] and their activities can show large changes over a narrow range of substrate concentration. Conversely, negative cooperativity makes enzymes insensitive to small changes in [S].
The Hill equation[27] is often used to describe the degree of cooperativity quantitatively in non-Michaelis–Menten kinetics. The derived Hill coefficient n measures how much the binding of substrate to one active site affects the binding of substrate to the other active sites. A Hill coefficient of <1 indicates negative cooperativity and a coefficient of >1 indicates positive cooperativity.
[edit] Pre-steady-state kinetics
In the first moment after an enzyme is mixed with substrate, no product has been formed and no intermediates exist. The study of the next few milliseconds of the reaction is called pre-steady-state kinetics. Pre-steady-state kinetics is therefore concerned with the formation and consumption of enzyme–substrate intermediates (such as ES or E*) until their steady-state concentrations are reached.
This approach was first applied to the hydrolysis reaction catalysed by chymotrypsin.[28] Often, the detection of an intermediate is a vital piece of evidence in investigations of what mechanism an enzyme follows. For example, in the ping–pong mechanisms that are shown above, rapid kinetic measurements can follow the release of product P and measure the formation of the modified enzyme intermediate E*.[29] In the case of chymotrypsin, this intermediate is formed by the attack of the substrate by the nucleophilic serine in the active site and the formation of the acyl-enzyme intermediate.
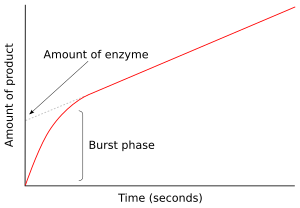
In the figure to the right, the enzyme produces E* rapidly in the first few seconds of the reaction. The rate then slows as steady state is reached. This rapid burst phase of the reaction measures a single turnover of the enzyme. Consequently, the amount of product released in this burst, shown as the intercept on the y-axis of the graph, also gives the amount of functional enzyme which is present in the assay.[30]
[edit] Chemical mechanism
An important goal of measuring enzyme kinetics is to determine the chemical mechanism of an enzyme reaction, i.e., the sequence of chemical steps that transform substrate into product. The kinetic approaches discussed above will show at what rates intermediates are formed and inter-converted, but they cannot identify exactly what these intermediates are.
Kinetic measurements taken under various solution conditions or on slightly modified enzymes or substrates often shed light on this chemical mechanism, as they reveal the rate-determining step or intermediates in the reaction. For example, the breaking of a covalent bond to a hydrogen atom is a common rate-determining step. Which of the possible hydrogen transfers is rate determining can be shown by measuring the kinetic effects of substituting each hydrogen by deuterium, its stable isotope. The rate will change when the critical hydrogen is replaced, due to a primary kinetic isotope effect, which occurs because bonds to deuterium are harder to break then bonds to hydrogen.[31] It is also possible to measure similar effects with other isotope substitutions, such as 13C/12C and 18O/16O, but these effects are more subtle.[32]
Isotopes can also be used to reveal the fate of various parts of the substrate molecules in the final products. For example, it is sometimes difficult to discern the origin of an oxygen atom in the final product; since it may have come from water or from part of the substrate. This may be determined by systematically substituting oxygen's stable isotope 18O into the various molecules that participate in the reaction and checking for the isotope in the product.[33] The chemical mechanism can also be elucidated by examining the kinetics and isotope effects under different pH conditions,[34] by altering the metal ions or other bound cofactors,[35] by site-directed mutagenesis of conserved amino acid residues, or by studying the behaviour of the enzyme in the presence of analogues of the substrate(s).[36]
[edit] Enzyme inhibition

Enzyme inhibitors are molecules that reduce or abolish enzyme activity. These are either reversible (i.e., removal of the inhibitor restores enzyme activity) or irreversible (i.e., the inhibitor permanently inactivates the enzyme).
[edit] Reversible inhibitors
Reversible enzyme inhibitors can be classified as competitive, uncompetitive, non-competitive or mixed, according to their effects on Km and Vmax. These different effects result from the inhibitor binding to the enzyme E, to the enzyme–substrate complex ES, or to both, as shown in the figure to the right and the table below. The particular type of an inhibitor can be discerned by studying the enzyme kinetics as a function of the inhibitor concentration. The four types of inhibition produce Lineweaver–Burke and Eadie–Hofstee plots[12] that vary in distinctive ways with inhibitor concentration. For brevity, two symbols are used:
![\alpha = 1 + \frac{[\mbox{I}]}{K_{i}}](http://upload.wikimedia.org/math/5/d/0/5d0ef5c67ccd4c852e6cfca33a00b3c1.png) and
and ![\alpha^{\prime} = 1 + \frac{[\mbox{I}]}{K_{i}^{\prime}}](http://upload.wikimedia.org/math/1/3/1/131b809d1c25e2a337f97992bbbc9593.png)
where Ki and K'i are the dissociation constants for binding to the enzyme and to the enzyme–substrate complex, respectively. In the presence of the reversible inhibitor, the enzyme's apparent Km and Vmax become (α/α')Km and (1/α')Vmax, respectively, as shown below for common cases.
| Type of inhibition | Km apparent | Vmax apparent | ||
| Ki only | ( ) ) |
competitive |  |
 |
| Ki' only | ( ) ) |
uncompetitive |  |
 |
| Ki = Ki' | ( ) ) |
non-competitive |  |
|
| Ki ≠ Ki' | ( ) ) |
mixed |  |
|
Non-linear regression fits of the enzyme kinetics data to the rate equations above[37] can yield accurate estimates of the dissociation constants Ki and K'i.
[edit] Irreversible inhibitors
Enzyme inhibitors can also irreversibly inactivate enzymes, usually by covalently modifying active site residues. These reactions, which may be called suicide substrates, follow exponential decay functions and are usually saturable. Below saturation, they follow first order kinetics with respect to inhibitor.
[edit] Mechanisms of catalysis

The favoured model for the enzyme–substrate interaction is the induced fit model.[38] This model proposes that the initial interaction between enzyme and substrate is relatively weak, but that these weak interactions rapidly induce conformational changes in the enzyme that strengthen binding. These conformational changes also bring catalytic residues in the active site close to the chemical bonds in the substrate that will be altered in the reaction.[39] After binding takes place, one or more mechanisms of catalysis lower the energy of the reaction's transition state by providing an alternative chemical pathway for the reaction. Mechanisms of catalysis include catalysis by bond strain; by proximity and orientation; by active-site proton donors or acceptors; covalent catalysis and quantum tunnelling.[29][40]
Enzyme kinetics cannot prove which modes of catalysis are used by an enzyme. However, some kinetic data can suggest possibilities to be examined by other techniques. For example, a ping–pong mechanism with burst-phase pre-steady-state kinetics would suggest covalent catalysis might be important in this enzyme's mechanism. Alternatively, the observation of a strong pH effect on Vmax but not Km might indicate that a residue in the active site needs to be in a particular ionisation state for catalysis to occur.
[edit] Footnotes
α. ^ Link: Interactive Michaelis–Menten kinetics tutorial (Java required)
β. ^ Link: dihydrofolate reductase mechanism (Gif)
γ. ^ Link: DNA polymerase mechanism (Gif)
δ. ^ Link: Chymotrypsin mechanism (Flash required)
[edit] References
- ^ Ebbing, D.D. General chemistry (4th edition) Houghton Mifflin Co. 1993, ISBN 0-395-63696-5
- ^ Eisenthal R. Danson M.J. (Eds), Enzyme Assays: A Practical Approach. Oxford University Press (2002) ISBN 0-19-963820-9
- ^ Xie XS, Lu HP. Single-molecule enzymology. J Biol Chem. 1999 Jun 4;274(23):15967-70. PMID 10347141
- ^ Lu H (2004). "Single-molecule spectroscopy studies of conformational change dynamics in enzymatic reactions". Current pharmaceutical biotechnology 5 (3): 261–9. doi:. PMID 15180547.
- ^ Schnell J, Dyson H, Wright P (2004). "Structure, dynamics, and catalytic function of dihydrofolate reductase". Annual review of biophysics and biomolecular structure 33: 119–40. doi:. PMID 15139807.
- ^ Gibson Q.H. Rapid mixing: Stopped flow Methods in Enzymology, (1969) 16:187–228
- ^ Duggleby, R.G. Analysis of enzyme progress curves by non-linear regression. Methods in Enzymology, (1995) 249:61–90.
- ^ Hammann C, Lilley DM. Folding and activity of the hammerhead ribozyme. Chembiochem. 2002 Aug 2;3(8):690–700. PMID 11779233
- ^ Michaelis L. and Menten M.L. Kinetik der Invertinwirkung Biochem. Z. 1913; 49:333–369 English translation Accessed 6 April 2007
- ^ Stroppolo ME, Falconi M, Caccuri AM, Desideri A (2001). "Superefficient enzymes". Cell. Mol. Life Sci. 58 (10): 1451–60. doi:. PMID 11693526.
- ^ Jones ME (01 Jan 1992). "Analysis of algebraic weighted least-squares estimators for enzyme parameters". Biochem. J. 288 ( Pt 2) (Pt 2): 533–8. PMID 1463456. http://www.pubmedcentral.nih.gov/articlerender.fcgi?tool=pubmed&pubmedid=1463456.
- ^ a b Tseng SJ, Hsu JP. A comparison of the parameter estimating procedures for the Michaelis–Menten model. J Theor Biol. 1990 Aug 23;145(4):457–64. PMID 2246896
- ^ Bravo, I.G., Busto, F., De Arriaga, D., Ferrero, M. A., Rodríguez-Aparicio, L. B., Martínez-Blanco H., Reglero, A. A normalised plot as a novel and time-saving tool in complex enzyme kinetic analysis Biochem. J. (2001). 358, 573–583. PMID 11577687
- ^ Almaas E, Kovacs B, Vicsek T, Oltvai ZN, Barabasi AL. Global organization of metabolic fluxes in the bacterium Escherichia coli. Nature. 2004 Feb 26;427(6977):839-43. PMID 14985762
- ^ Reed JL, Vo TD, Schilling CH, Palsson BO. An expanded genome-scale model of Escherichia coli K-12 (iJR904 GSM/GPR). Genome Biol. 2003;4(9):R54. PMID 12952533
- ^ for a complete derivation, see here
- ^ Dirr H, Reinemer P, Huber R. X-ray crystal structures of cytosolic glutathione S-transferases. Implications for protein architecture, substrate recognition and catalytic function. Eur J Biochem. 1994 Mar 15;220(3):645-61. PMID 8143720
- ^ Stone SR, Morrison JF. Dihydrofolate reductase from Escherichia coli: the kinetic mechanism with NADPH and reduced acetylpyridine adenine dinucleotide phosphate as substrates. Biochemistry. 1988 Jul 26;27(15):5493–9. PMID 3052577
- ^ Fisher PA. Enzymologic mechanism of replicative DNA polymerases in higher eukaryotes. Prog Nucleic Acid Res Mol Biol. 1994;47:371-97. PMID 8016325
- ^ Akerman SE, Muller S. 2-Cys peroxiredoxin PfTrx-Px1 is involved in the antioxidant defence of Plasmodium falciparum. Mol Biochem Parasitol. 2003 Aug 31;130(2):75-81. PMID 12946843
- ^ Bravo, I.G., Barrallo, S., Ferrero, M. A., Rodríguez-Aparicio, L. B., Martínez-Blanco H., Reglero, A. “Kinetic properties of the Acylneuraminate Cytidylytransferase from Pasteurella haemolytica A2”. Biochem. J. (2001) 358, 585-598. [1]
- ^ Kraut J. Serine proteases: structure and mechanism of catalysis. Annu Rev Biochem. 1977;46:331-58. PMID 332063
- ^ Ricard J, Cornish-Bowden A. Co-operative and allosteric enzymes: 20 years on. Eur J Biochem. 1987 Jul 15;166(2):255-72. PMID 3301336
- ^ Ward WH, Fersht AR., Tyrosyl-tRNA synthetase acts as an asymmetric dimer in charging tRNA. A rationale for half-of-the-sites activity. Biochemistry. 1988 Jul 26;27(15):5525–30. PMID 3179266
- ^ Helmstaedt K, Krappmann S, Braus GH., Allosteric regulation of catalytic activity: Escherichia coli aspartate transcarbamoylase versus yeast chorismate mutase. Microbiol. Mol. Biol. Rev. 2001 Sep;65(3):404-21 PMID 11528003
- ^ Schirmer T, Evans PR., Structural basis of the allosteric behaviour of phosphofructokinase. Nature. 1990 Jan 11;343(6254):140-5. PMID 2136935
- ^ Hill, A. V. The possible effects of the aggregation of the molecules of haemoglobin on its dissociation curves. J. Physiol. (Lond.), 1910 40, iv-vii.
- ^ Hartley B.S. and Kilby B.A. The reaction of p-nitrophenyl esters with chymotrypsin and insulin. Biochem J. 1954 Feb;56(2):288-97. PMID 13140189
- ^ a b Alan Fersht, Structure and Mechanism in Protein Science : A Guide to Enzyme Catalysis and Protein Folding. W. H. Freeman, 1998. ISBN 0-7167-3268-8
- ^ Bender ML, Begue-Canton ML, Blakeley RL, Brubacher LJ, Feder J, Gunter CR, Kezdy FJ, Killheffer JV Jr, Marshall TH, Miller CG, Roeske RW, Stoops JK. The Determination of the Concentration of Hydrolytic Enzyme Solutions : a-Chymotrypsin, Trypsin, Papain, Elastase, Subtilisin, and Acetylcholinesterase. J Am Chem Soc. 1966 Dec 20;88(24):5890-913. PMID 5980876
- ^ Cleland WW. The use of isotope effects to determine enzyme mechanisms. Arch Biochem Biophys. 2005 Jan 1;433(1):2–12. PMID 15581561
- ^ Northrop D (1981). "The expression of isotope effects on enzyme-catalyzed reactions". Annu. Rev. Biochem. 50: 103–31. doi:. PMID 7023356.
- ^ Baillie T, Rettenmeier A (1986). "Drug biotransformation: mechanistic studies with stable isotopes". Journal of clinical pharmacology 26 (6): 448–51. PMID 3734135.
- ^ Cleland WW. Use of isotope effects to elucidate enzyme mechanisms. CRC Crit Rev Biochem. 1982;13(4):385–428. PMID 6759038
- ^ Christianson DW, Cox JD. Catalysis by metal-activated hydroxide in zinc and manganese metalloenzymes. Annu Rev Biochem. 1999;68:33–57. PMID 10872443
- ^ Kraut D, Carroll K, Herschlag D (2003). "Challenges in enzyme mechanism and energetics". Annu. Rev. Biochem. 72: 517–71. doi:. PMID 12704087.
- ^ Leatherbarrow RJ. Using linear and non-linear regression to fit biochemical data. Trends Biochem Sci. 1990 Dec;15(12):455–8. PMID 2077683
- ^ Koshland DE, Application of a Theory of Enzyme Specificity to Protein Synthesis. Proc. Natl. Acad. Sci. U.S.A. 1958 Feb;44(2):98–104. PMID 16590179
- ^ Hammes G (2002). "Multiple conformational changes in enzyme catalysis". Biochemistry 41 (26): 8221–8. doi:. PMID 12081470.
- ^ Sutcliffe M, Scrutton N (2002). "A new conceptual framework for enzyme catalysis. Hydrogen tunnelling coupled to enzyme dynamics in flavoprotein and quinoprotein enzymes". Eur. J. Biochem. 269 (13): 3096–102. doi:. PMID 12084049. http://content.febsjournal.org/cgi/content/full/269/13/3096.
[edit] Further reading
Introductory
- Athel Cornish-Bowden, Fundamentals of Enzyme Kinetics. (3rd edition), Portland Press 2004, ISBN 1-85578-158-1.
- Nicholas Price, Lewis Stevens, Fundamentals of Enzymology, Oxford University Press, 1999. ISBN 0-19-850229-X
- Tim Bugg, An Introduction to Enzyme and Coenzyme Chemistry Blackwell Publishing, 2004 ISBN 1-4051-1452-5
Advanced
- Irwin H. Segel, Enzyme Kinetics : Behavior and Analysis of Rapid Equilibrium and Steady-State Enzyme Systems. Wiley-Interscience; New Ed edition 1993, ISBN 0-471-30309-7.
- Alan Fersht, Structure and Mechanism in Protein Science : A Guide to Enzyme Catalysis and Protein Folding. W. H. Freeman, 1998. ISBN 0-7167-3268-8
- Santiago Schnell, Philip K. Maini, A century of enzyme kinetics: Reliability of the KM and vmax estimates, Comments on Theoretical Biology 8, 169–187, 2004 DOI: 10.1080/08948550390206768
- Chris Walsh, Enzymatic Reaction Mechanisms. W. H. Freeman and Company. 1979. ISBN 0-7167-0070-0
- Paul F. Cook and W.W. Cleland Enzyme kinetics and mechanism Garland Science, 2007 ISBN 0-8153-4140-7
[edit] External links
- Animation of an enzyme assay — Shows effects of manipulating assay conditions
- MACiE — A database of enzyme reaction mechanisms
- ENZYME — Expasy enzyme nomenclature database
- ExCatDB — A database of enzyme catalytic mechanisms
- BRENDA — Comprehensive enzyme database, giving substrates, inhibitors and reaction diagrams
- SABIO-RK — A database of reaction kinetics
- Joseph Kraut's Research Group, University of California San Diego — Animations of several enzyme reaction mechanisms
- Symbolism and Terminology in Enzyme Kinetics — A comprehensive explanation of concepts and terminology in enzyme kinetics
- An introduction to enzyme kinetics — An accessible set of on-line tutorials on enzyme kinetics
- Enzyme kinetics animated tutorial — An animated tutorial with audio
|
||||||||

