List of countries by carbon dioxide emissions
From Wikipedia, the free encyclopedia
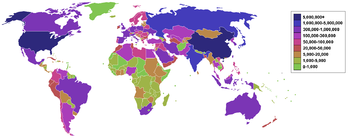
This is a list of sovereign states by carbon dioxide emissions due to human activity. The data presented below corresponds to emissions in 2004. The data itself was collected in 2007 by the CDIAC for United Nations. The data considers only carbon dioxide emissions from the burning of fossil fuels, but not emissions from deforestation, and fossil fuel exporters, etc.
These statistics are rapidly dated due to huge recent growth of emissions in Asia. The United States is the 10th largest emitter of carbon dioxide emissions per capita as of 2004.[1] According to preliminary estimates, since 2006 China has had a higher total emission due to its much larger population and an increase of emissions from power generation.[2][3][4][5][6][7] China is the 91st largest emitter of carbon dioxide emissions per capita as of 2004.
Some dependencies and territories whose independence has not been generally recognized are also included, as they are in source data.
Certain entities are mentioned here for purposes of comparison. These are indicated in italics and are not counted in the ordering of sovereign states. (See also: carbon cycle)
Contents |
[edit] List of countries by 2004 emissions
| Rank | Country | Annual CO2 emissions (in thousands of metric tons) |
Percentage of total emissions[8] |
| - | 27,245,758 | 100.0 %
|
|
| 1 | 6,049,435 | 22.2 %
|
|
| 2 | 5,010,170 | 18.4 %
|
|
| - | 4,001,222 | 14.7 % | |
| 3 | 1,524,993 | 5.6 % | |
| 4 | 1,342,962 | 4.9 % | |
| 5 | 1,257,963 | 4.6 % | |
| 6 | 860,522 | 3.1 % | |
| 7 | 639,403 | 2.3 % | |
| 8 | 587,261 | 2.2 % | |
| 9 | 465,643 | 1.7 % | |
| 10 | 449,948 | 1.7 % | |
| 11 | 438,022 | 1.6 % | |
| 12 | 437,032 | 1.6 % | |
| 13 | 433,571 | 1.6 % | |
| 14 | 378,250 | 1.4 % | |
| 15 | 373,693 | 1.4 % | |
| 16 | 331,795 | 1.2 % | |
| 17 | 330,497 | 1.2 % | |
| 18 | 330,039 | 1.2 % | |
| 19 | 326,757 | 1.2 % | |
| 20 | 308,393 | 1.1 % | |
| 21 | 307,238 | 1.1 % | |
| 22 | 268,082 | 1.0 % | |
| 23 | 226,125 | 0.8 % | |
| 24 | 200,278 | 0.7 % | |
| 25 | 194,001 | 0.7 % | |
| 26 | 177,584 | 0.7 % | |
| 27 | 172,623 | 0.6 % | |
| 28 | 158,237 | 0.6 % | |
| 29 | 149,188 | 0.5 % | |
| 30 | 142,061 | 0.5 % | |
| 31 | 141,786 | 0.5 % | |
| 32 | 137,907 | 0.5 % | |
| 33 | 125,669 | 0.5 % | |
| 34 | 116,991 | 0.4 % | |
| 35 | 114,025 | 0.4 % | |
| 36 | 100,716 | 0.4 % | |
| 37 | 99,364 | 0.4 % | |
| 38 | 98,663 | 0.4 % | |
| 39 | 96,695 | 0.4 % | |
| 40 | 90,425 | 0.3 % | |
| 42 | 81,652 | 0.3 % | |
| 43 | 80,512 | 0.3 % | |
| 44 | 79,111 | 0.3 % | |
| 45 | 71,247 | 0.3 % | |
| 46 | 69,846 | 0.3 % | |
| 47 | 68,420 | 0.3 % | |
| 48 | 65,799 | 0.2 % | |
| 49 | 64,890 | 0.2 % | |
| 50 | 62,418 | 0.2 % | |
| 51 | 59,914 | 0.2 % | |
| 52 | 58,906 | 0.2 % | |
| 53 | 57,183 | 0.2 % | |
| 54 | 53,634 | 0.2 % | |
| 55 | 53,322 | 0.2 % | |
| 56 | 53,033 | 0.2 % | |
| 57 | 52,956 | 0.2 % | |
| 58 | 52,904 | 0.2 % | |
| 59 | 52,252 | 0.2 % | |
| 60 | 43,149 | 0.2 % | |
| 60 | 42,558 | 0.2 % | |
| 61 | 42,353 | 0.2 % | |
| 62 | 41,726 | 0.2 % | |
| 63 | 41,169 | 0.2 % | |
| 64 | 40,457 | 0.2 % | |
| 65 | 37,411 | 0.1 % | |
| 66 | 37,165 | 0.1 % | |
| 67 | 36,289 | 0.1 % | |
| 68 | 32,557 | 0.1 % | |
| 69 | 31,570 | 0.1 % | |
| 70 | 31,493 | 0.1 % | |
| 71 | 31,365 | 0.1 % | |
| 72 | 30,899 | 0.1 % | |
| 73 | 29,268 | 0.1 % | |
| 74 | 25,818 | 0.1 % | |
| 75 | 23,501 | 0.1 % | |
| 77 | 22,885 | 0.1 % | |
| 78 | 21,114 | 0.1 % | |
| 79 | 19,640 | 0.1 % | |
| 80 | 18,944 | 0.1 % | |
| 81 | 16,949 | 0.1 % | |
| 82 | 16,465 | 0.1 % | |
| 83 | 16,263 | 0.1 % | |
| 84 | 16,212 | 0.1 % | |
| 85 | 15,596 | 0.1 % | |
| 86 | 13,309 | 0.1 % | |
| 87 | 12,220 | 0.1 % | |
| 88 | 11,534 | <0.1 % | |
| 89 | 11,277 | <0.1 % | |
| 90 | 10,592 | <0.1 % | |
| 91 | 10,588 | <0.1 % | |
| 92 | 10,559 | <0.1 % | |
| 93 | 10,420 | <0.1 % | |
| 94 | 10,372 | <0.1 % | |
| 95 | 9,760 | <0.1 % | |
| 96 | 8,810 | <0.1 % | |
| 97 | 8,553 | <0.1 % | |
| 98 | 7,982 | <0.1 % | |
| 99 | 7,897 | <0.1 % | |
| 100 | 7,685 | <0.1 % | |
| 101 | 7,615 | <0.1 % | |
| 102 | 7,190 | <0.1 % | |
| 103 | 7,098 | <0.1 % | |
| 104 | 6,973 | <0.1 % | |
| 105 | 6,750 | <0.1 % | |
| 106 | 6,405 | <0.1 % | |
| 107 | 6,167 | <0.1 % | |
| 108 | 5,727 | <0.1 % | |
| 109 | 5,661 | <0.1 % | |
| 110 | 5,477 | <0.1 % | |
| 111 | 5,426 | <0.1 % | |
| 112 | 5,162 | <0.1 % | |
| 113 | 5,004 | <0.1 % | |
| 114 | 4,993 | <0.1 % | |
| 115 | 4,352 | <0.1 % | |
| 116 | 4,301 | <0.1 % | |
| 117 | 4,180 | <0.1 % | |
| 118 | 4,088 | <0.1 % | |
| 119 | 4,007 | <0.1 % | |
| 120 | 3,912 | <0.1 % | |
| 121 | 3,839 | <0.1 % | |
| 122 | 3,674 | <0.1 % | |
| 123 | 3,648 | <0.1 % | |
| 124 | 3,542 | <0.1 % | |
| 125 | 3,197 | <0.1 % | |
| 126 | 3,043 | <0.1 % | |
| 127 | 2,731 | <0.1 % | |
| 128 | 2,577 | <0.1 % | |
| 129 | 2,555 | <0.1 % | |
| 130 | 2,471 | <0.1 % | |
| 131 | 2,453 | <0.1 % | |
| 132 | 2,449 | <0.1 % | |
| 133 | 2,387 | <0.1 % | |
| 134 | 2,310 | <0.1 % | |
| 135 | 2,288 | <0.1 % | |
| 136 | 2,284 | <0.1 % | |
| 137 | 2,277 | <0.1 % | |
| 138 | 2,229 | <0.1 % | |
| 139 | 2,207 | <0.1 % | |
| 140 | 2,167 | <0.1 % | |
| 141 | 2,156 | <0.1 % | |
| 142 | 2,104 | <0.1 % | |
| 143 | 2,009 | <0.1 % | |
| 144 | 1,826 | <0.1 % | |
| 145 | 1,756 | <0.1 % | |
| 146 | 1,734 | <0.1 % | |
| 147 | 1,445 | <0.1 % | |
| 148 | 1,371 | <0.1 % | |
| 149 | 1,338 | <0.1 % | |
| 150 | 1,291 | <0.1 % | |
| 151 | 1,280 | <0.1 % | |
| 152 | 1,269 | <0.1 % | |
| 153 | 1,214 | <0.1 % | |
| 154 | 1,096 | <0.1 % | |
| 155 | 1,071 | <0.1 % | |
| 156 | 1,045 | <0.1 % | |
| 157 | 1,005 | <0.1 % | |
| 158 | 994 | <0.1 % | |
| 159 | 957 | <0.1 % | |
| 160 | 792 | <0.1 % | |
| 161 | 755 | <0.1 % | |
| 162 | 726 | <0.1 % | |
| 163 | 693 | <0.1 % | |
| 164 | 671 | <0.1 % | |
| 165 | 660 | <0.1 % | |
| 166 | 649 | <0.1 % | |
| 167 | 572 | <0.1 % | |
| 168 | 572 | <0.1 % | |
| 169 | 565 | <0.1 % | |
| 170 | 550 | <0.1 % | |
| 171 | 546 | <0.1 % | |
| 172 | 535 | <0.1 % | |
| 173 | 470 | <0.1 % | |
| 174 | 414 | <0.1 % | |
| 175 | 414 | <0.1 % | |
| 176 | 374 | <0.1 % | |
| 177 | 367 | <0.1 % | |
| 178 | 367 | <0.1 % | |
| 179 | 312 | <0.1 % | |
| 180 | 286 | <0.1 % | |
| 181 | 275 | <0.1 % | |
| 182 | 271 | <0.1 % | |
| 183 | 253 | <0.1 % | |
| 184 | 238 | <0.1 % | |
| 185 | 238 | <0.1 % | |
| 186 | 220 | <0.1 % | |
| 187 | 216 | <0.1 % | |
| 188 | 198 | <0.1 % | |
| 189 | 176 | <0.1 % | |
| 190 | 176 | <0.1 % | |
| 191 | 150 | <0.1 % | |
| 192 | 143 | <0.1 % | |
| 193 | 125 | <0.1 % | |
| 194 | 125 | <0.1 % | |
| 195 | 117 | <0.1 % | |
| 196 | 106 | <0.1 % | |
| 197 | 92 | <0.1 % | |
| 198 | 88 | <0.1 % | |
| 199 | 88 | <0.1 % | |
| 200 | 84 | <0.1 % | |
| 201 | 62 | <0.1 % | |
| 202 | 62 | <0.1 % | |
| 203 | 44 | <0.1 % | |
| 204 | 29 | <0.1 % | |
| 205 | 29 | <0.1 % | |
| 206 | 11 | <0.1 % | |
| 207 | 4 | <0.1 % |
[edit] See also
- List of countries by carbon dioxide emissions per capita
- List of countries by greenhouse gas emissions per capita
- List of countries by ratio of GDP to carbon dioxide emissions
- List of countries by electricity production from renewable source
- Avoiding Dangerous Climate Change
- Carbon cycle
- Emission standard
- Greenhouse gas emissions by the United States
- Kyoto Protocol
- World energy resources and consumption
- Climate change
- Global warming
- Asian brown cloud
[edit] Notes and references
- ^ Raupach, M.R., G. Marland, P. Ciais, C. Le Quéré, J.G. Canadell, G. Klepper & C.B. Field. (2007). "Global and regional drivers of accelerating CO2 emissions". Proc. Nat. Acad. Sci. 104 (24): 10288–93. doi:. PMID 17519334.
- ^ "China now no. 1 in CO2 emissions; USA in second position". Netherlands Environmental Assessment Agency. http://www.mnp.nl/en/dossiers/Climatechange/moreinfo/Chinanowno1inCO2emissionsUSAinsecondposition.html. Retrieved on 2007-06-22.
- ^ "China Overtakes U.S. as No. 1 Emitter of Carbon Dioxide". Sci-Tech Today. 2006-06-21. http://www.sci-tech-today.com/news/China-No--1-Emitter-of-Carbon-Dioxide/story.xhtml?story_id=111006822NEU.
- ^ "Greenhouse Gas Emissions Rise in China". NPR. 2008-03-14. http://www.npr.org/templates/story/story.php?storyId=88251868.
- ^ "China CO2 Emissions Growing Faster Than Anticipated". National Geographic. 2008-03-18. http://news.nationalgeographic.com/news/2008/03/080318-china-warming.html.
- ^ "Forecasting the Path of China’s CO2 Emissions Using Province Level Information". Department of Agricultural & Resource Economics, UCB. CUDARE Working Paper 97. 2008-03-14. http://repositories.cdlib.org/cgi/viewcontent.cgi?article=1050&context=are_ucb.
- ^ http://www.cgdev.org/content/article/detail/16578/
- ^ Human Produced carbon dioxide only, total carbon dioxide in atmosphere is 2,700,000,000 thousand tons (See also: Carbon cycle)
- ^ Including American Samoa, Guam, Puerto Rico, Turks and Caicos, US Virgin Islands
- ^ Including San Marino
- ^ Including Monaco
[edit] External links
The contents of this article comes from the latest figures from the millennium indicators as of 2007-08-26:
United Nations Framework Convention on Climate Change GHG emissions data:
A visual real-time simulation that uses this Co2 emissions data:

