Monopsony
From Wikipedia, the free encyclopedia
In economics, a monopsony (from Ancient Greek μόνος (monos) "single" + ὀψωνία (opsōnia) "purchase") is a market form in which only one buyer faces many sellers. It is an example of imperfect competition, similar to a monopoly, in which only one seller faces many buyers. As the only purchaser of a good or service, the "monopsonist" may dictate terms to its suppliers in the same manner that a monopolist controls the market for its buyers.
The term was first introduced by Joan Robinson in her influential[1] book, The Economics of Imperfect Competition. Robinson credits classics scholar Bertrand Hallward of Peterhouse College, Cambridge with coining the term.
A single-payer health care system, in which the government is the only "buyer" of healthcare services, is an example of a monopsony. It has also been argued[2] that Wal-Mart, in the United States, functions as a monopsony in certain market segments, as its buying power for a given item may dwarf the remaining market.
Contents |
[edit] Overview
The term "monopsony power", in a manner similar to "monopoly power" is used by economists as a short hand reference to buyers who face an upwardly sloping supply curve but that are not the only buyer; better, but more cumbersome terms may be oligopsony or monopsonistic competition. A monopsonist may at the same time be a monopolist.
A monopsonist has market power, because it can affect the market price of the purchased good by varying the quantity bought. Formally, this is so because a monopsonist faces a supply curve with a finite (and generally positive) price elasticity. However, one can find this condition – and hence monopsony power – also in markets with more than one buyer. In all such cases the resulting market form is called an oligopsony.
For most practical purposes, what matters is monopsony power as such, whether it is exercised by one or more subjects. In standard microeconomics, where monopsonists or oligopsonists are assumed to be profit-maximizing firms, monopsony power leads to a market failure, due to a restriction of the quantity purchased relative to the (Pareto-) optimal competitive outcome. Moreover, markets with monopsony power are predicted to react differently to public price regulations. Monopsony power is thus relevant from both the normative and positive points of view. The practical importance of its effects depends however on its actual intensity, measured by the size of the deviation from competitive outcomes.
Traditional microeconomics tended to assume that in most modern cases such intensity was small enough to be ignored, justifying as an acceptable approximation the general use of much simpler competitive models. The only and oft-quoted exception to this principle was assumed to be the labour markets of the nineteenth-century "company towns", which were isolated mining centres with only one employer (the mining company) for almost everybody.
This view has however been variously questioned by the more recent literature devoted to the actual measurement of monopsony power in observed markets. On the one hand, econometric exercises on the available data have apparently ruled out significant labour monopsony for the typical West Virginia "company towns" of the early twentieth century: see Boal (1995). On the other hand, many observations appear to suggest significant monopsony power in various contemporary labour markets, from baseball players to nurses, college professors and many others. There have also been attempts to measure possible monopsony power in some non-labour markets as well.
Reasoning a priori, the specific dynamics of labour markets – and particularly search behaviour by workers – may indeed formally produce upward-sloping labour supply curves faced by most individual firms in the short run: see Mortensen (1970). On the longer-run supply behaviour of dynamic models, however, it is much more difficult to get simple general results on purely theoretical grounds, so that any firm conclusion must come from case-by-case empirical analysis.
A wide and useful survey of both the theoretical and empirical literature on monopsony in labour markets may be found in Boal and Ransom (1997). See also the large bibliography provided at the end of Manning (2003).
[edit] Static monopsony in a labor market

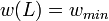
The standard textbook monopsony model refers to static partial equilibrium in a labor market with just one employer who pays the same wage to all its workers. In this model, the employer is assumed to be a firm facing an upward-sloping labor supply curve, represented by the S blue curve in the diagram on the right. This curve relates the wage paid, w, to the level of employment, L, and is denoted as the increasing function w(L). Total labor costs are then given by w(L)L. Assume now that the firm has a total revenue R, which increases with L according to the concave function R(L). It wants to choose L to maximize profits, which are given by:
 .
.
This leads to the first-order condition:
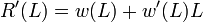 .
.
The left-hand side of this expression is the marginal revenue product of labor (roughly, the extra revenue produced by an extra worker) and is represented by the red MRP curve in the diagram. The right-hand side is the marginal cost of labor (roughly, the extra cost due to an extra worker) and is represented by the green MC curve in the diagram. It should be noticed that this marginal cost is higher than the wage w(L) paid to the new worker by the amount
 .
.
This is because the firm has to increase the wage paid to all the workers it already employs whenever it hires an extra worker. In the diagram, this leads to a MC curve that is above the supply curve S.
The first-order condition for maximum profit is then satisfied at point A of the diagram, where the MC and MRP curves intersect. This determines the profit-maximising employment as L on the horizontal axis. The corresponding wage w is then obtained from the supply curve, through point M.
The monopsonistic equilibrium at M should now be contrasted with the equilibrium that would obtain under competitive conditions. Suppose a competitor employer entered the market and offered a wage higher than that at M. Then every employee of the first employer would choose instead to work for the competitor. Moreover, the competitor would gain all the former profits of the first employer, minus a less-than-offsetting amount from the wage increase of the first employer's employees, plus profits arising from additional employees who decided to work in the market because of the wage increase. But the first employer would respond by offering an even higher wage, poaching the new rival's employees, and so forth. In other words, a group of perfectly competitive firms would be forced, through competition, to intersection C rather than M. Just as a monopoly is thwarted by the competition to win sales, minimizing prices and maximizing output, competition for employees between the employers in this case would maximize both wages and employment, as shown in the graph.
[edit] Welfare implications

The lower employment and wage caused by monopsony power has two distinct effects on the economic welfare of the people involved. First, it redistributes welfare away from workers and to their employer(s). Secondly, it reduces the aggregate (or social) welfare enjoyed by both groups taken together, as the employers' net gain is smaller than the loss inflicted on workers.
The diagram on the right illustrates both effects, using the standard approach based on the notion of economic surplus. According to this notion, the workers' economic surplus (or net gain from the exchange) is given by the area between the S curve and the horizontal line corresponding to the wage, up to the employment level. Similarly, the employers' surplus is the area between the horizontal line corresponding to the wage and the MRP curve, up to the employment level. The social surplus is then the sum of these two areas.
Following such definitions, the grey rectangle in the diagram is the part of the competitive social surplus that has been redistributed from the workers to their employer(s) under monopsony. By contrast, the yellow triangle is the part of the competitive social surplus that has been lost by both parties, as a result of the monopsonistic restriction of employment. This is a net social loss and is called deadweight loss. It is a measure of the market failure caused by monopsony power, through a wasteful misallocation of resources.
As the diagram suggests, the size of both effects increases with the difference between the marginal revenue product MRP and the market wage determined on the supply curve S. This difference corresponds to the vertical side of the yellow triangle, and can be expressed as a proportion of the market wage, according to the formula:
 .
.
The ratio e has been called the rate of exploitation, and it can be easily shown that it equals the reciprocal of the elasticity of the labour supply curve faced by the firm. Thus the rate of exploitation is zero under competitive conditions, when this elasticity tends to infinity. Empirical estimates of e by various means are a common feature of the applied literature devoted to the measurement of observed monopsony power.
Finally, it is important to notice that, while the gray-area redistribution effect could be reversed by fiscal policy (i.e., taxing employers and transferring the tax revenue to the workers), this is not so for the yellow-area deadweight loss. The market failure can only be addressed in one of two ways: either by breaking up the monopsony through anti-trust intervention, or by regulating the wage policy of firms. The most common kind of regulation is a binding minimum wage higher than the monopsonistic wage.
[edit] Minimum wage

A binding minimum wage can be introduced either by law or through collective bargaining, and its possible effects in a special case are shown in the diagram on the right.
Here the minimum wage is w'', higher than the monopsonistic w. At this given wage the firm can now hire all the workers it wants, up to the supply curve, so that in the relevant employment range its marginal cost of labor becomes effectively constant and equal to w'', as shown by the new black horizontal line MC'. Hence the firm maximizes profits at the new intersection point A, choosing the employment level L'', which is higher than the monopsonistic level L. As the reader can check, the rate of exploitation has been reduced to zero.
More generally, a binding minimum wage modifies the form of the supply curve faced by the firm, which becomes:

where w(L) is the original supply curve and wmin is the minimum wage. The new curve has thus a horizontal first branch and a kink at the point
as is shown in the diagram by the kinked black curve MC' S. The resulting equilibria can then fall into one of three classes or regimes, according to the value taken by the minimum wage, as is seen by the following table:
| Minimum wage | Resulting equilibrium | |
|---|---|---|
| First regime | not higher than monopsony wage | unchanged from monopsony |
| Second regime | higher than monopsony wage but not higher than competitive wage |
at kink of supply curve |
| Third regime | higher than competitive wage | at intersection where minimum wage equals MRP |
As it is now seen, the example illustrated by the diagram belongs to the third regime. As a result, there is an excess supply of labor – i.e. involuntary unemployment – equal to the segment AB. So, although the exploitation rate has vanished, there is still a deadweight loss to society. This illustrates the problems that may arise when the proper level of the binding minimum wage is not exactly known, or cannot be enforced for political reasons.
Yet, even when it is sub-optimal, a minimum wage higher than the market rate raises the level of employment anyway. This is a highly remarkable result, because it only follows under monopsony. Indeed, under competitive conditions any minimum wage higher than the market rate would actually reduce employment, according to classical economic models. Thus, spotting the effects on employment of newly introduced minimum wage regulations is among the indirect ways economists use to pin down monopsony power in selected labor markets.
[edit] Wage discrimination
Just like a monopolist, a monopsonistic employer may find that its profits are maximized if it discriminates prices. In this case this means paying different wages to different groups of workers even if their MRP is the same, with lower wages paid to the workers who have a lower elasticity of supply of their labor to the firm.
Some researchers have tried to use this fact to explain at least part of the observed wage differentials whereby women earn often less than men, even after controlling for observed productivity differentials. However, all such attempts have had to contend with the statistical fact that in most cases women actually display a higher labor supply elasticity than men.
Some authors have argued informally that, while this is so for market supply, the reverse may somehow be true of the supply to individual firms. In particular, Manning and others have shown that, in the case of the UK Equal Pay Act, implementation has led to higher employment of women. Since the Act was effectively minimum wage legislation for women, this might perhaps be interpreted as a symptom of monopsonistic discrimination.
[edit] Dynamic problems
In many real-world situations a monopsonist firm will have to maximise its profits through time, rather than instantaneously as in the previous static model. In all such cases, any short-run outcomes will have to be balanced against longer-run ones, and the resulting equilibrium may differ.
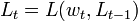
The simplest dynamic model to bring out this idea, used in Boal and Ransom (1997), is one where the supply of labour to the firm reacts to wage changes with a lag, due for instance to information costs and search behaviour. Assume hence that the supply function has a distributed-lag specification, leading to:
 ,
,
where the subscript refers to the time period and L is increasing in both arguments. Inverting this function gives:
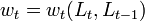 ,
,
with
 .
.
If the firm has a time-discount rate r, the present value of profits is now given by:
![\sum_{t=1}^\infty\left [R_t(L_t)-w_t(L_t,L_{t-1})L_t\right]\left(\frac{1}{1+r}\right)^{t-1}\,\!](http://upload.wikimedia.org/math/2/6/2/262a2a1a1160675bb7715feb334cb3d9.png) .
.
The tth first-order condition to maximise this present value is:
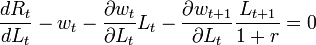 .
.
Define next the short-run simultaneous and lagged inverse supply elasticities respectively as:
 .
.
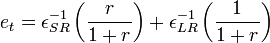
Now, assume these elasticities to be constant over time. Assume further a steady state, with Lt = Lt + 1 and wt = wt + 1. Then the first-order condition gives the exploitation rate as:
 .
.
Finally, the steady-state long-run inverse elasticity,  , is given by the sum of the two short-run inverse elasticities defined above, and so one has:
 .
.
The exploitation rate is thus a weighted average of the short- and long-run inverse supply elasticities, where the weight of the long-run one is much bigger, because r is much smaller than unity even when the discounting period is one year. It follows that, as the long-run (direct) supply elasticity of labour tends to be much higher than the short-run one, this very simple dynamic model predicts an exploitation rate which is much smaller than the one produced by static analysis.
However, less simplified dynamic models tell less simple stories. Even the employment effect of minimum wages is not as clear cut as static models would have.
but does this weman labour discrimination still exist?
[edit] Empirical problems
The simplified dynamics sketched above suggests that the frequent observation of short-run relative inelasticity of labour supply to individual firms may not be very relevant to the diagnosis of significant monopsony power. Efforts to measure the size of the exploitation rate in specific labour markets have hence taken various forms:
-
- direct measurement of wage and MRP
- estimates of the long-run supply elasticity of labour to firms
- cross-sectional comparisons of wages and employer concentration
- correlations between wages and workers' mobility
- structural estimation of equilibrium search models
- employment effects of minimum wages
The results of these empirical works are rarely unambiguous. However, even in cases such as coal miners or nurses, most US studies suggest rates of exploitation probably lower than marginal tax rates on workers' incomes, or union relative wage effects. The better documented instances of significant exploitation are found in the probably rare cases of explicit collusion, such as US baseball before the reserve clause.
[edit] The sources of labour monopsony power
The simpler explanation of monopsony power in labour markets is barriers to entry on the demand side. In all such cases, oligopsony would result from oligopoly in the product markets of the industries that use that type of labour as input. If the hypothesis was generally true, one would then find a positive statistical correlation between exploitation, on one side, and industry concentration and firm size on the other. However, numerous statistical studies document significant positive correlations between firm or establishment size and wages. These results, by themselves inconsistent with the oligopoly-oligopsony hypothesis, may be due to the prevalence of other factors, such as efficiency wages.
However, monopsony power might also be due to circumstances affecting entry of workers on the supply side, directly reducing the elasticity of labour supply to firms. Paramount among these are moving costs for workers, which are also a cause of differentiation among potential employees, possibly leading to discrimination (see above). But a similar effect might also be produced by all the institutional factors that limit labour mobility between firms, including job protection legislation. Finally, as already noticed, a significant reduction in the short-run elasticity of supply may come from information costs and search behaviour.
An alternative that has been suggested as a source of monopsony power is worker preferences over job characteristics (Bhaskar and To, 1999; Bhaskar, Manning and To, 2002). Such job characteristics can include distance from work, type of work, location, the social environment at work, etc. If different workers have different preferences, employers have local monopsony power over workers that strongly prefer working for them.
[edit] Monopsony in Public Admistration and product markets
The same or similar empirical difficulties dog attempts to identify significant monopsony in non-labour markets, and specifically in markets for intermediate goods bought as inputs by very large firms. Among the most likely US candidates, one finds in the literature:
-
- trade in technological knowledge: Rodriguez (1975)
- tomatoes for tomato processing: Just and Chern (1980)
- beef for the beef packing industry: Schroeter (1988)
- western coal for electric utilities: Atkinson and Kerkvliet (1989)
- pulpwood and sawlogs: Murray (1995)
- sophisticated weaponry (i.e. jet fighters, tanks, artillery, etc.)
A related issue is the role of monopsony power from the point of view of anti-trust policy affecting vertical integrations. It has been argued that vertical integration by a monopsony – whereby the production of the previously bought input becomes an in-house operation – may reduce or eliminate the inefficiencies due to monopsonistic restriction of purchases.
In Australia, the Pharmaceutical Industry can be viewed as a kind of monopsony, as the Commonwealth government is the principal buyer of products through the Pharmaceutical Benefits Scheme (PBS)
In the US, several, including Harper's and the PBS program Frontline, have made the case that Wal-Mart is a monopsonist, dictating terms to suppliers, whilst at the same time a monopolist dictating terms to consumers - at least in certain market segments [3][4].
[edit] See also
- Bilateral monopoly
- Canadian Wheat Board—a (formerly general, now limited) monopsony in agriculture
- Captive supply
- Market forms
- Minimum wage
- Monopoly
- Oligopsony
- Single-payer health care
- WalMart
[edit] Further Reading
- Atkinson, S.E. and J. Kerkvliet (1989) 'Dual Measures of Monopoly and Monopsony Power: An Application to Regulated Electric Utilities' The Review of Economics and Statistics 71 2 pp. 250-257.
- Bhaskar, V. and T. To (1999) 'Minimum Wages for Ronald McDonald Monopsonies: A Theory of Monopsonistic Competition,' The Economic Journal, 109, 190–203.
- Bhaskar, V., A. Manning and T. To (2002) 'Oligopsony and Monopsonistic Competition in Labor Markets,' Journal of Economic Perspectives, 16, 155–174.
- Boal, W.M. (1995) 'Testing for Employer Monopsony in Turn-of-the-Century Coal Mining' The RAND Journal of Economics 26 3 pp. 519-36.
- Boal, W.M. and M.R. Ransom (1997) 'Monopsony in the Labor Market' Journal of Economic Literature 35 1 pp. 86-112.
- Just, R.E. and W.S. Chern (1980) 'Tomatoes, Technology, and Oligopsony' The Bell Journal of Economics 11 2 pp. 584-602.
- Lynn, Barry C (2006) 'Breaking the Chain: The antitrust case against Wal-Mart' Harper's Magazine July 2006
- Manning, A. (2003) Monopsony in Motion: Imperfect Competition in Labour Markets Princeton: Princeton Univ. Press.
- Murray, B.C. (1995) 'Measuring Oligopsony Power with Shadow Prices: U.S. Markets for Pulpwood and Sawlogs' The Review of Economics and Statistics 77 3 pp. 486-98.
- Robinson, J. (1933) The Economics of Imperfect Competition London: Macmillan.
- Rodriguez, C.A. (1975) 'Trade in Technological Knowledge and the National Advantage' The Journal of Political Economy 83 1 pp. 121-36.
- Schroeter, J.R. (1988), 'Estimating the Degree of Market Power in the Beef Packing Industry' The Review of Economics and Statistics 70 1 pp. 158-62.
[edit] External links
- Breaking the Chain: The antitrust case against Wal-Mart Harper's Magazine, July 2006
- Monopsony in American Labor Markets from EH.NET's Encyclopedia
[edit] Footnotes
- ^ Kerr, Prue; Harcourt, Geoff (2002), Joan Robinson: Critical Assessments of Leading Economists, Taylor & Francis, pp. 2-3, ISBN 0415217431
- ^ http://www.pbs.org/wgbh/pages/frontline/shows/walmart
- ^ http://harpers.org/BreakingTheChain.html
- ^ http://www.pbs.org/wgbh/pages/frontline/shows/walmart

