Standard score
From Wikipedia, the free encyclopedia
In statistics, a standard score is a dimensionless quantity derived by subtracting the population mean from an individual raw score and then dividing the difference by the population standard deviation. This conversion process is called standardizing or normalizing; however, "normalizing" can refer to many types of ratios; see normalization (statistics) for more.
Standard scores are also called z-values, z-scores, normal scores, and standardized variables.
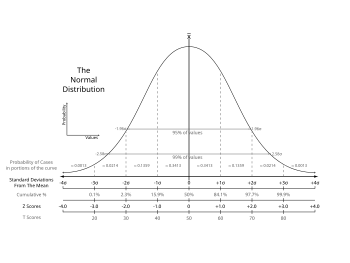
The standard score indicates how many standard deviations an observation is above or below the mean. It allows comparison of observations from different normal distributions, which is done frequently in research.
The standard score is not the same as the z-factor used in the analysis of high-throughput screening data, but is sometimes confused with it.
The standard deviation is the unit of measurement of the z-score.
Contents |
[edit] Formula
The standard score is
where:
- x is a raw score to be standardized;
- μ is the mean of the population;
- σ is the standard deviation of the population.
The quantity z represents the distance between the raw score and the population mean in units of the standard deviation. z is negative when the raw score is below the mean, positive when above.
A key point is that calculating z requires the population mean and the population standard deviation, not the sample mean or sample deviation. It requires knowing the population parameters, not the statistics of a sample drawn from the population of interest. But knowing the true standard deviation of a population is often unrealistic except in cases such as standardized testing, where the entire population is measured. In cases where it is impossible to measure every member of a population, the standard deviation may be estimated using a random sample. For example, a population of people who smoke cigarettes is not fully measured.
If using sample mean and sample deviation, one should instead use studentized residuals, as there is the added complication that variations of residuals do not in general equal variations of errors.
When a population is normally distributed, the percentile rank may be determined from the standard score and statistical tables.
[edit] Standardizing in mathematical statistics
In mathematical statistics, a random variable X is standardized using the theoretical (population) mean and standard deviation:
where μ = E(X) is the mean and σ = the standard deviation of the probability distribution of X.
If the random variable under consideration is the sample mean:
then the standardized version is
See normalization (statistics) for other forms of normalization.
[edit] References
Richard J. Larsen and Morris L. Marx: An Introduction to Mathematical Statistics and Its Applications, Third Edition, p. 282.
[edit] External links
- A Guide to Understanding & Calculating the Standard Score (Z-Score)
- Z-Score to percentile conversion table With a given Z-Score, calculate the value's percentile rank.
- Z-Score to percentile calculator Converts Z-Scores into percentiles (1 & 2 Sided).
- Normal Distribution & calculation of Z-Scores and percentile rank with Excel functions
[edit] See also
|
|||||||||||||||||||||||||||||||||||||||||||||||||||||||||


